
. 2017 Aug 28;2017:4646789. doi: 10.1155/2017/4646789
Copyright © 2017 Rudá França Moreira et al.
This is an open access article distributed under the Creative Commons Attribution License, which permits unrestricted use, distribution, and reproduction in any medium, provided the original work is properly cited.
Figure 1.
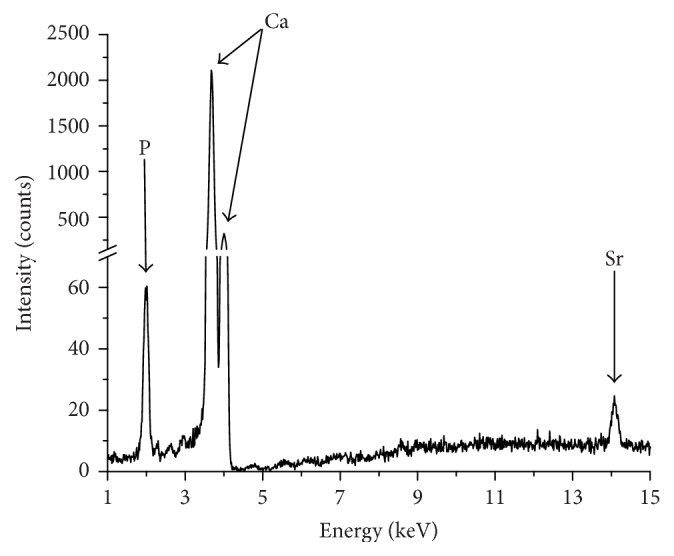
X-ray fluorescence spectrum of tooth enamel.