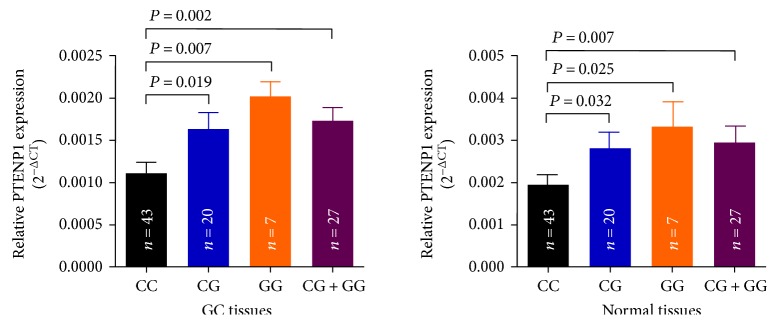
Figure 1.
Correlation between rs7853346 genotypes and expression of PTENP1 mRNA. PTENP1 levels were determined by qRT-PCR in GC tissues and adjacent normal tissues in subjects with the CC (n = 43), CG (n = 20) or GG (n = 7) genotype at rs7853346. Results were shown as mean ± standard error relative to β-actin levels. The significant level was corrected with the formula of α′ = α/3 = 0.017 according to the Bonferroni method.

