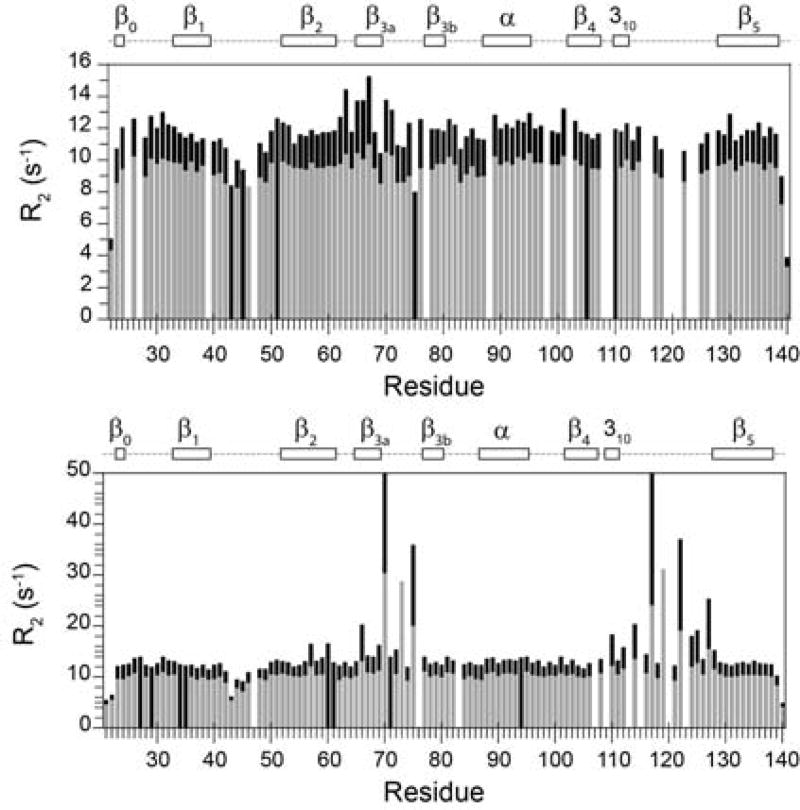
Fig. 9. 15 N Transverse relaxation measurements for the backbone amide resonances in the FK1 domain of FKBP52 and FKBP51 at 25°C.
Transverse (R2) relaxation rates at 600 (gray) and 900 (black) MHz 1H are shown for FKBP52 (upper panel) and FKBP51 (lower panel). In addition to proline residues, relaxation data is not reported for overlapped resonances and for the severely broadened resonances. Illustration as modified from research originally published [72], the Biochemical Society copyright holder.

