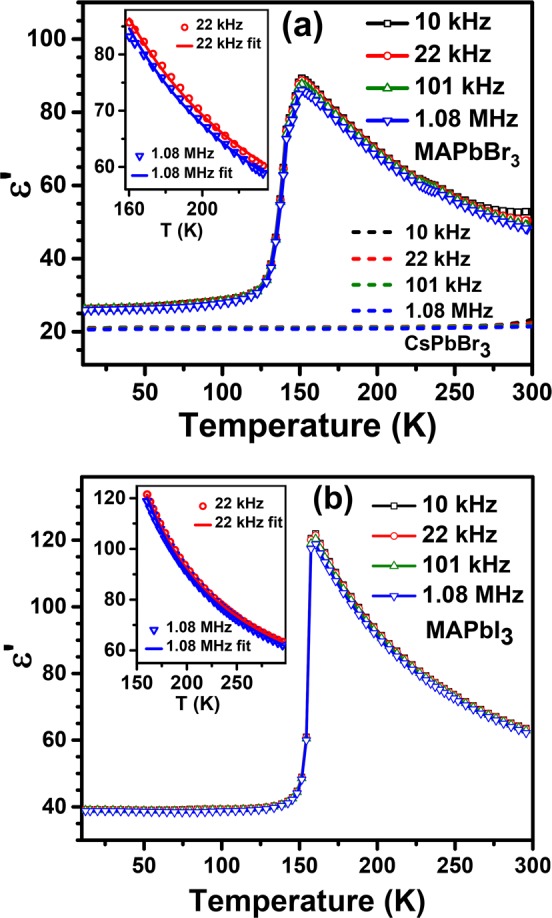
Figure 1.

Dielectric constant, ε′, versus temperature for selected frequencies measured on MAPbBr3 (symbol and solid lines) and CsPbBr3 (dashed lines) (a) and MAPbI3 (b). The insets in (a) and (b) show the fit to the experimental data of the dielectric constant vs temperature in the tetragonal phase of MAPbBr3 and MAPbI3, respectively.
