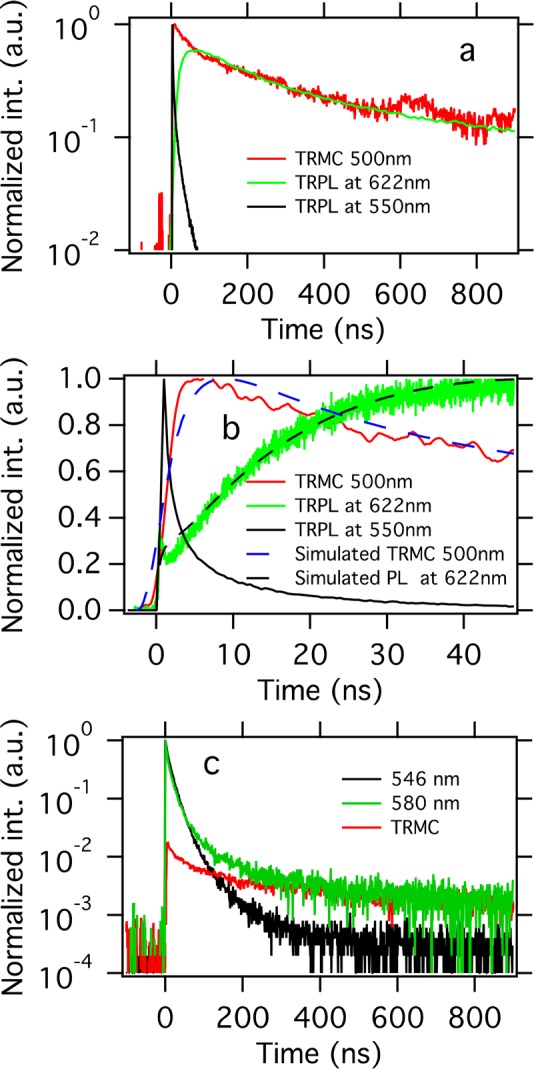
Figure 4.

(a) Comparison of TRMC (red) and TRPL (green at 622 nm and black at 550 nm) signals at 90 K, orthorhombic phase. The TRMC trace is recorded using an excitation wavelength of 500 nm, while the excitation wavelength for the TRPL is 405 nm; the incident numbers of photons are 1013 and 4 × 10¹²/cm2, respectively. (b) Same traces as those in (a) on shorter time scales: note, the TRPL at 622 nm shows a slow 40 ns rise time. Dashed lines: calculated TRMC and TRPL by the model introduced in Scheme 1. (c) Comparison of TRMC (red) and TRPL (black at 546 nm and green at 580 nm) signals at 300 K, cubic phase.
