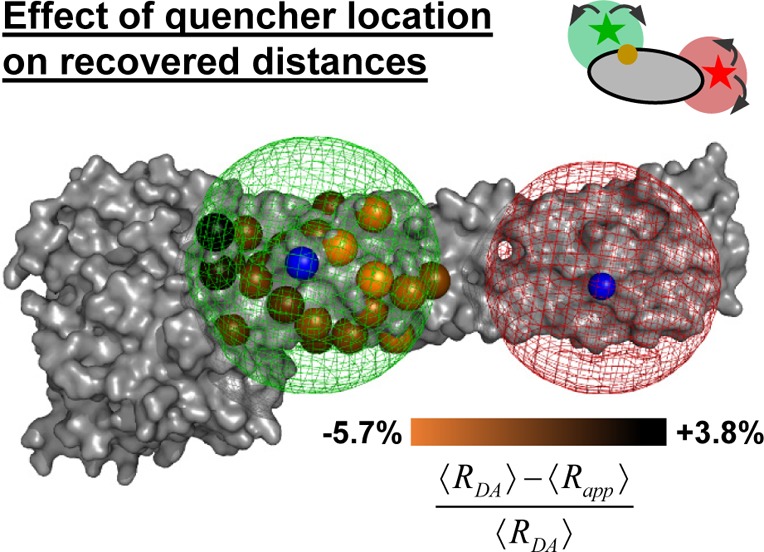
Figure 10.

Average donor–acceptor distance and the recovered average distance systematically deviate on a small scale. The effect of the quencher location on the mean apparent distance between the donor, D, and acceptor, A , ⟨Rapp⟩ is illustrated using a crystal structure (PDB-ID: 1F5N) of the human guanylate binding protein 1. A set of 23 simulations (quencher located at amino acid number: 156, 158, 299, 313, 317, 321, 325, 326, 329, 336, 329, 336, 374, 378, 382, 387, 390, 393, 524, 532, 538, 539, 542) was performed. The simulations consider dye diffusion and D quenching. The relative distance difference between the average distance ⟨RDA⟩ (52 Å) and the average apparent distance ⟨Rapp⟩ was mapped on the Cβ-atom of the respective quencher. The D and A accessible volume are shown as green and red mesh, respectively. The blue spheres mark the attachment points of D (F379C) and A (D467C).
