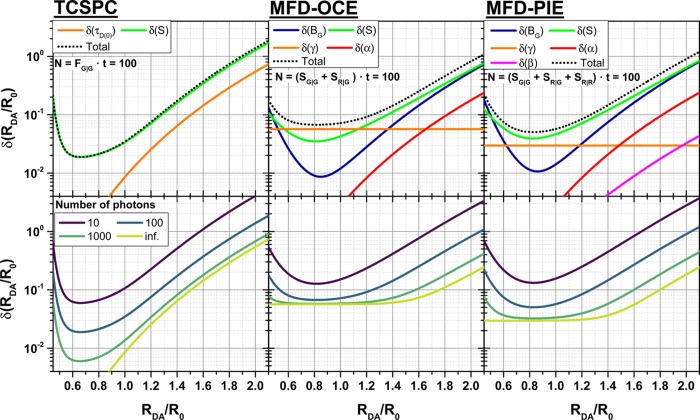
Figure 11.
Relative error of a normalized donor–acceptor distance, δ(RDA/R0), depends on the normalized donor–acceptor distance, RDA/R0, and a number of experimental parameters. Estimated relative uncertainties δ(RDA/R0) of the DA distance, RDA, for a given number of detected photons, N, with dependence of the distance RDA/R0 for time-correlated single photon counting (TCSPC), intensity-based measurements by multiparameter fluorescence detection (MFD) with one-color excitation (OCE), and pulsed-interleaved excitation (PIE). On the top the contributions of the shot noise and the relevant calibration/correction parameters (colored solid lines) are shown. The resulting total uncertainty is shown as a dotted line. On the bottom, the distance-dependent scaling of the total uncertainty is shown for a different number of photons. The uncertainties for TCSPC were estimated by eqs 46–51 using a radiative rate constant of kF,D = 0.25 ns–1 and a relative error corresponding to the donor fluorescence variation among different protein samples in Figure 1 (τD(0) = 3.9 ± 0.2 ns). The time-window, T = 16 ns, of the fluorescence decay histogram was separated into 53 detection channels resulting in a detection channel width of 0.3 ns (the typical width of an instrument response function in single-molecule (sm) detection). The uncertainties of the MFD-OCE and MFD-PIE measurements were calculated by eqs 35–45. In both cases the fluorescence quantum yield of the donor and acceptor were ΦF,D = 0.8 and ΦF,A = 0.3, respectively. In the MFD-OCE and MFD-PIE plots, α = 0.02 ± 0.005, γ′ = 0.8 ± 0.05, and ΦF,A = 0.3. The relative fractions of the nonfluorescent background were BG|G/IG|G = 0.02 and BR|G/IR|G = 0.01. In MFD-PIE, BR|R/IR|R = 0.02, η = 0.02 ± 0.01, and β = 0.3 ± 0.1. In MFD-OCE, ΔΦF,A = 0.05.

