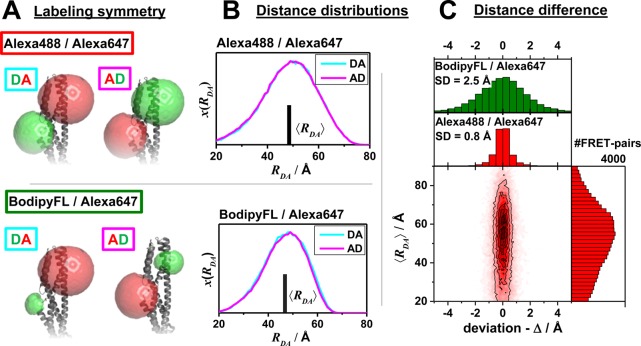
Figure 13.
Deviation of the distance distribution between a donor, D, and an acceptor, A, for the two possible combinations DA and AD was studied to assess the error of a random labeling. The effect of labeling symmetry on the expected distance distributions evaluated by the accessible volume (AV) simulations (see Supporting Information, Note S3). (A) AVs of Alexa488/Alexa647- and BodipyFL/Alexa647-dye pairs attached to the amino acids Q344C/A496C of a hGBP1 protein structure (PDB-ID: 1DG3). (B) The resulting distance distributions x(RDA) and mean distances ⟨RDA⟩. (C) Comparison of both possible average distances for a set of large protein structures (with more than 360 amino acids). The average distances ⟨RDA⟩ = 1/2(⟨RDA(DA)⟩ + ⟨RDA⟩) are plotted vs their deviation Δ = ⟨RDA(DA)⟩ + ⟨RDA⟩ in a two-dimensional histogram for a random set of fluorophore pairs for Alexa488/Alexa647 (red). The histograms to the side and the top are the projections of the respective axes. For the dye pair BodipyFL/Alexa647 only a histogram of Δ is shown (green).

