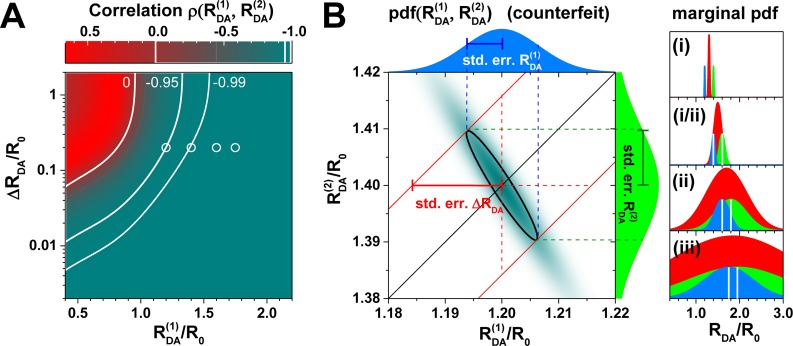
Figure 15.
Distances estimated
by time-resolved fluorescence measurements
for the simplest bimodal model of two discrete distances are highly
correlated. (A) Correlation coefficients  . (B, left) The 2D probability distribution
function (counterfeit normal) of observed estimates of parameters
  ,
,  for expectations
  ,
,  . (B, right) The marginal (1D projections)
probability distribution functions of estimations of
  (blue),
  (green),
and the probability distribution
functions of ΔRDA estimation (red,
shifted for comparison) for 4 sets of expected parameters marked by
circles in Figure 14A,B and here in panel A. Indices (i, ii, iii) correspond to the regions
defined in Figure 14B.

