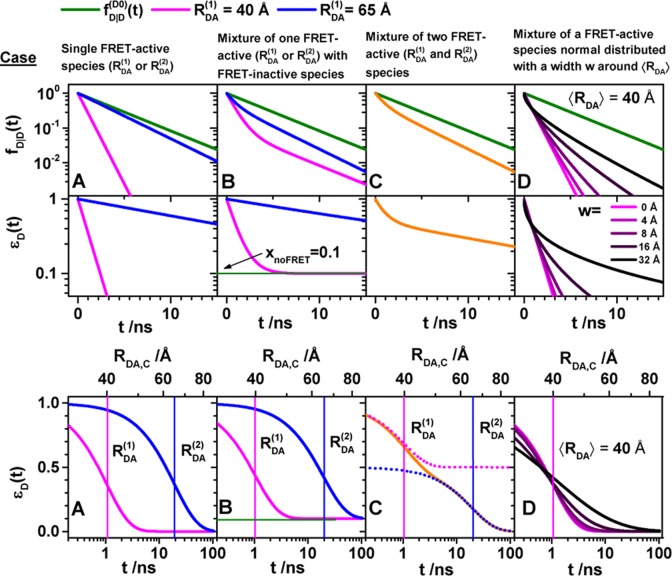
Figure 3.
FRET-induced donor decay directly visualizes FRET rate constants and donor–acceptor distances. Fluorescence intensity decays of a donor fD|D(t) (top row) in the absence (green) and in the presence (blue, magenta, and orange) of FRET. The corresponding FRET-induced donor decays, εD(t)’s, are shown in the lower two rows. The fluorescence decays were calculated by eq 13 (single FRET-active species), eq 16 (mixture of FRET-active and FRET-inactive species), and eq 18 (mixture of FRET species and distribution of FRET species) (R0 = 50 Å and kD–1 = 4.0 ns). Information on FRET is obtained by comparing the fluorescence decay of the donor in the presence of an acceptor (blue or magenta) to its reference given by the fluorescence decay in the absence of FRET (green). εD(t) contains the reference implicitly. In the middle row, εD(t) is shown in linear scale. In the lower row, εD(t) is shown with a logarithmic time axis, and the time t between excitation and detection of fluorescence was converted into a critical donor–acceptor distance axis RDA,C by eq 15. This allows for the determination of the characteristic times of FRET kRET–1 and distances graphically at the point where εD(t) decayed to the value 1/e (shown as vertical lines). The time t corresponds to the DA distance of the FRET process. (A) Single distance of RDA = 40 Å (magenta) and RDA = 65 Å (blue), respectively. (B) Mixture of a FRET-active RDA = 40 Å (magenta) and RDA = 65 Å (blue) and a FRET-inactive species (fraction, xnoFRET = 0.1). (C) Mixture of two FRET-active species RDA(1) = 40 Å (50%) and RDA(2) = 65 Å (50%) (orange). The position and the height of the “steps” in the lowest plot relate to the FRET rate constant and the species fractions of the individual species. For comparison, the components (dotted blue and magenta lines) of the individual species are overlaid. (D) Normal distributed distance with a mean of ⟨RDA⟩ = 40 Å and a distribution width varying from 0 to 32 Å (black to magenta).

