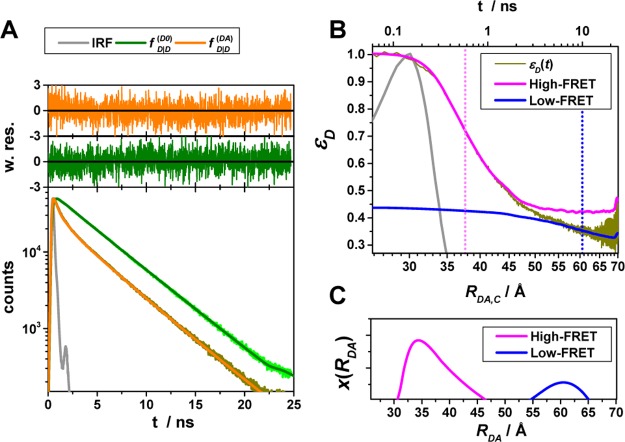
Figure 4.
Experimental data can be visualized by the FRET-induced donor decay to reveal donor–acceptor distance distributions. Experimental fluorescence decays, FRET-induced donor decay, and maximum entropy analysis (MEM) of ensemble measurements of the human guanylate binding protein 1 dimer (hGBP1) singly labeled at amino acid Q577C by the donor, D (Alexa 488), and the acceptor, A (Alexa 647), respectively. The dimerization was induced by 500 μM GTPγS. (A) Donor fluorescence decays in the absence (τD(1) = 4.2, xD(1) = 0.94, τD(2) = 1.7 ns, xD(2) = 0.06) (green) and in the presence (orange) of an acceptor; the instrument response function (IRF) is shown as a gray line. The time axis measures the time between excitation and detection of donor photons. (B) Corresponding FRET-induced donor decay εD(t). The distance axis RDA,C(t) is given by the Förster relationship RDA,C = R0(ΦF,Dtk0,D)1/6 (k0,D–1 = 4.1 ns, R0 = 52 Å). The fluorescence decay was analyzed by a two component (N = 2) model (Supporting Information eq S1 in Note S1) using a width of w = 12 Å). The individual components with average distances of 38 and 58 Å are visualized by solid magenta and blue lines, respectively. (C) The DA distance distribution obtained by analyzing the fluorescence decays by the maximum entropy method (magenta high FRET, blue low FRET, dark-yellow experimental FRET-induced donor decay, orange fit).

