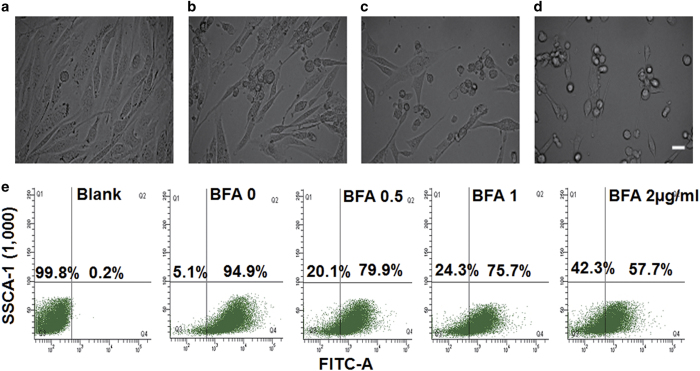
Figure 2.
The effect of BFA on TC-1 cancer cells. The morphological changes of the TC-1 cancer cells treated by different concentrations of BFA for 24 h (a–d represent TC-1 tumor cell that were treated by BFA with 0, 0.5, 1, and 2 μg/ml, respectively). Scale bar: 25 μm. (e) Determination of Δψm.TC-1 cells were treated with various concentrations of BFA for 24 h and then stained with rhodamine 123. Loss of Δψm was visualized as a reduction in the fluorescence signal. The proportions of cells with rhodamine 123 staining are shown as the average value of three replicated experiments.

