Figure 4.
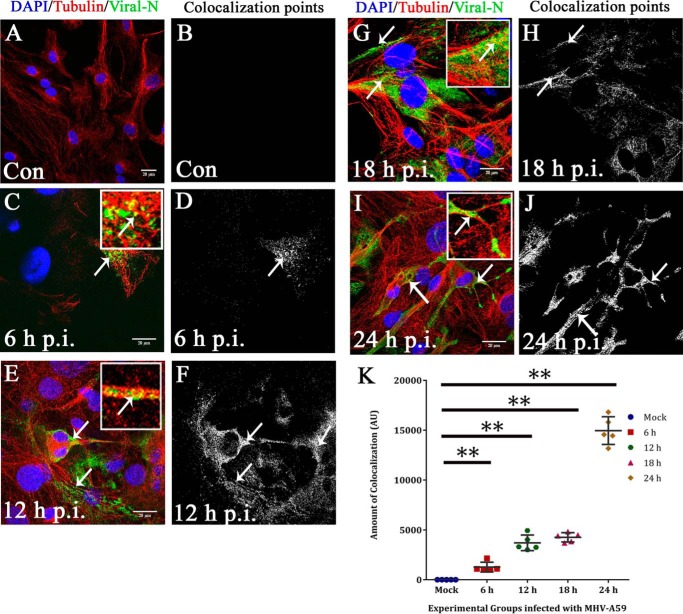
Kinetics of viral particle spread along microtubule threads. To observe viral spread along MT threads, primary astrocytes were mock-infected (A and B) or MHV-A59–infected at 6 h (C and D), 12 h (E and F), 18 h (G and H), and 24 h (I and J) p.i., and cells were labeled for β-tubulin (red) and viral N (green). The amount of anti-N staining increased from 6 to 24 h p.i. At 6 and 12 h p.i., discrete viral particles were observed on MT threads (C and E, arrow and inset), and colocalization points were mainly located at the cell periphery (D and F). At 18 and 24 h p.i., anti-N signal was more dispersed throughout the whole cell, and toward the cell border, viral particles were localized on MTs (G and I, arrow and inset). The number of colocalization points increased visually, and they were mainly located at the cell periphery and cell-to-cell junctions (H and J). Spots containing colocalization of signal were counted and plotted with increasing time p.i. Colocalization spots increased from 6 to 12 to 18 h p.i. and reached a maximum at 24 h p.i. (**, p < 0.01 each for 6, 12, and 18 h p.i. and 24 h p.i. as compared with mock; Mann-Whitney U test). Kruskal–Wallis testing showed that the difference was significant in a five-group comparison (***, p < 0.001). Five to six fields were analyzed for each group from n = 3 experiments (K). Error bars, S.D. AU, arbitrary units.

