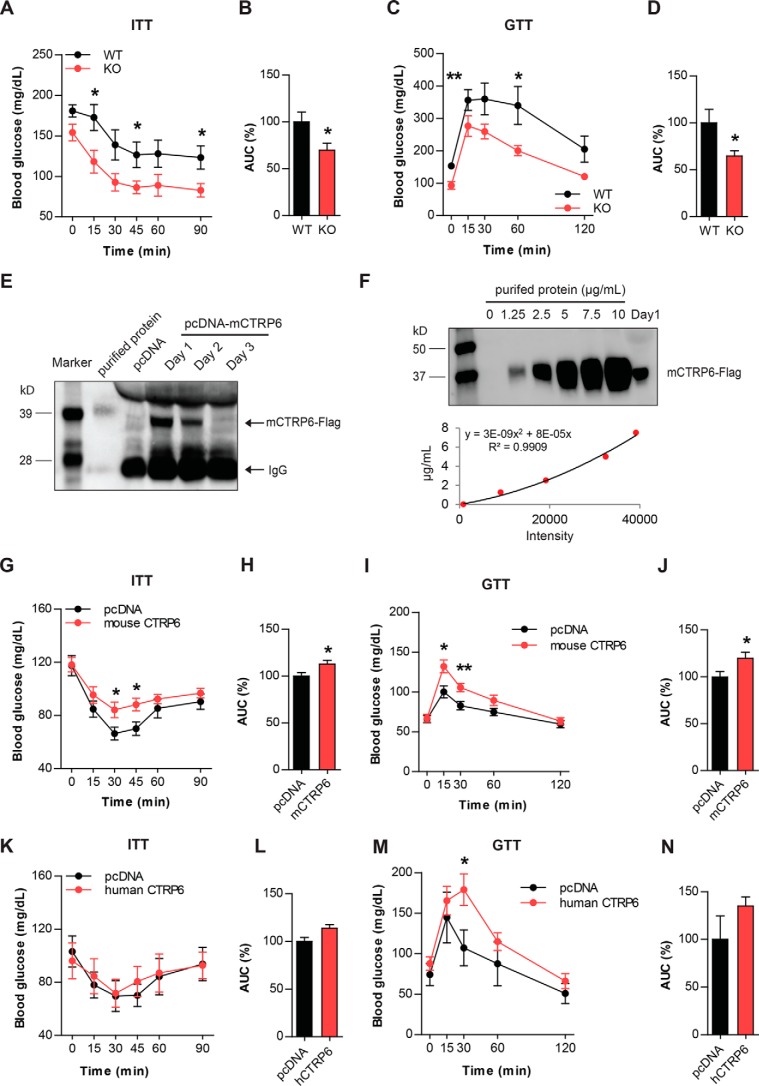
Figure 9.
Altered glucose and insulin tolerance in CTRP6-overexpressing and KO male mice. A–D, blood glucose levels at the indicated time points during ITT and GTT in WT and Ctrp6 KO mice fed an HFD. Area under the curve (AUC) was calculated and shown as a percentage in B and D. WT, n = 8; KO, n = 6. E, Western blot analysis of FLAG epitope-tagged mouse CTRP6 in serum from mice injected with expression plasmid encoding CTRP6 via the HTV injection method. Serum from mice expressing control pcDNA3.1 plasmid (Invitrogen) was used as a negative control. Western blotting was carried out using anti-FLAG M2 antibody (Sigma). F, to estimate the serum level of CTRP6 on day 1 after HTV injection, Western blotting was performed using purified protein as a standard with a 4-fold diluted serum sample. Band density was analyzed by ImageJ software. The level of CTRP6 in serum is ∼5.6 μg/ml. G–J, blood glucose levels at the indicated time points during ITT and GTT in chow-fed WT mice overexpressing pCDNA3 control plasmid (n = 9–10) or mouse CTRP6 (n = 9–10). AUC was calculated and shown as a percentage in H and J. K–N, blood glucose levels at the indicated time points during ITT and GTT in chow-fed WT mice overexpressing pCDNA3 control plasmid (n = 6) or human CTRP6 (n = 6). AUC was calculated and shown as a percentage in L and N. *, p < 0.05; **, p < 0.01. Error bars, S.E.

