Figure 1.
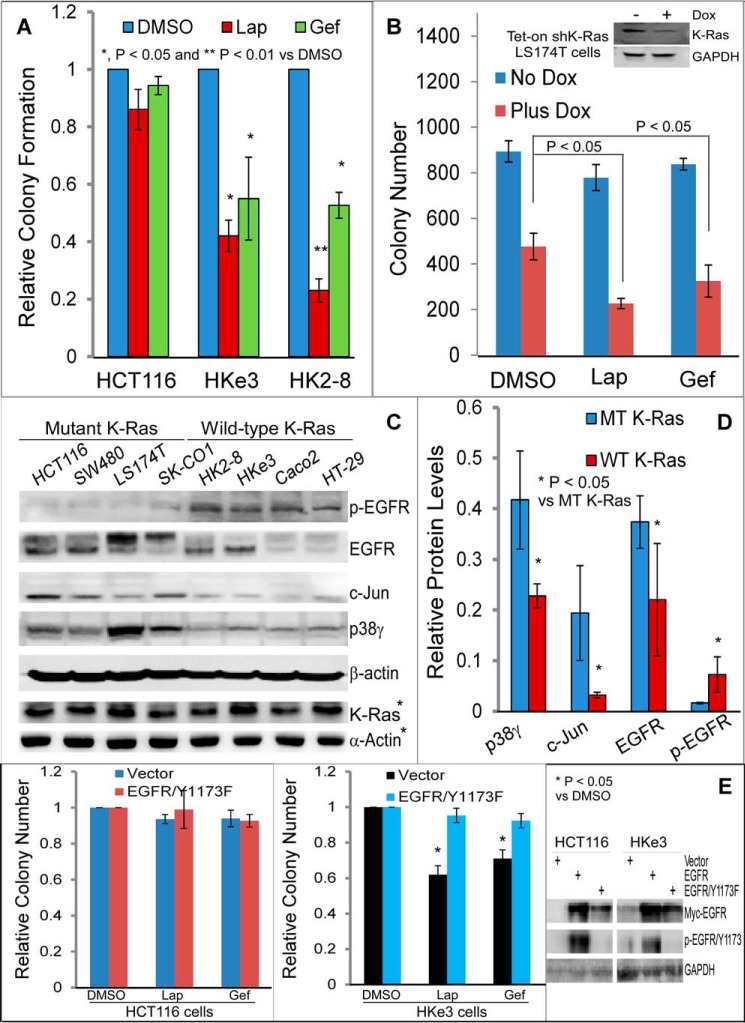
Resistance of K-Ras mutated cancer cells to EGFR TKIs couples both with increased p38γ, c-Jun, and EGFR expression and with decreased EGFR phosphorylation. A, the indicated cells were cultured in the presence and absence of TKIs (Lap (2 μm) and Gef (0.125 μm)) for about 2 weeks, and the number of colonies formed was manually counted. Results were normalized to DMSO control (mean ± S.D. (error bars), n = 3). B, cells were cultured with the indicated TKIs in the absence and presence of Dox for colony formation (mean ± S.D., n = 3), with the inset showing mutant K-Ras knockdown after Dox addition overnight. C and D, K-Ras WT and MT cancer cells were analyzed by WB (C, p-EGFR detected with anti-p-EGFR/Tyr-1173 antibody and the same for all other p-EGFR unless specified) and band intensities from these cell lines (C, asterisk indicates results from a separate experiment) were measured by Image Quant software (normalized to β-actin). Quantitative combined results from C are presented in D (mean ± S.D., n = 4). E, EGFR/Y1173F was stably expressed by retrovirus, and the engineered cells were assessed for colony formation. The bar graph (left and middle) is from three separate experiments (mean ± S.D., n = 3), whereas WB shows EGFR expression and phosphorylation (right, EGFR transfection used as a positive control for p-EGFR/Tyr-1173).

