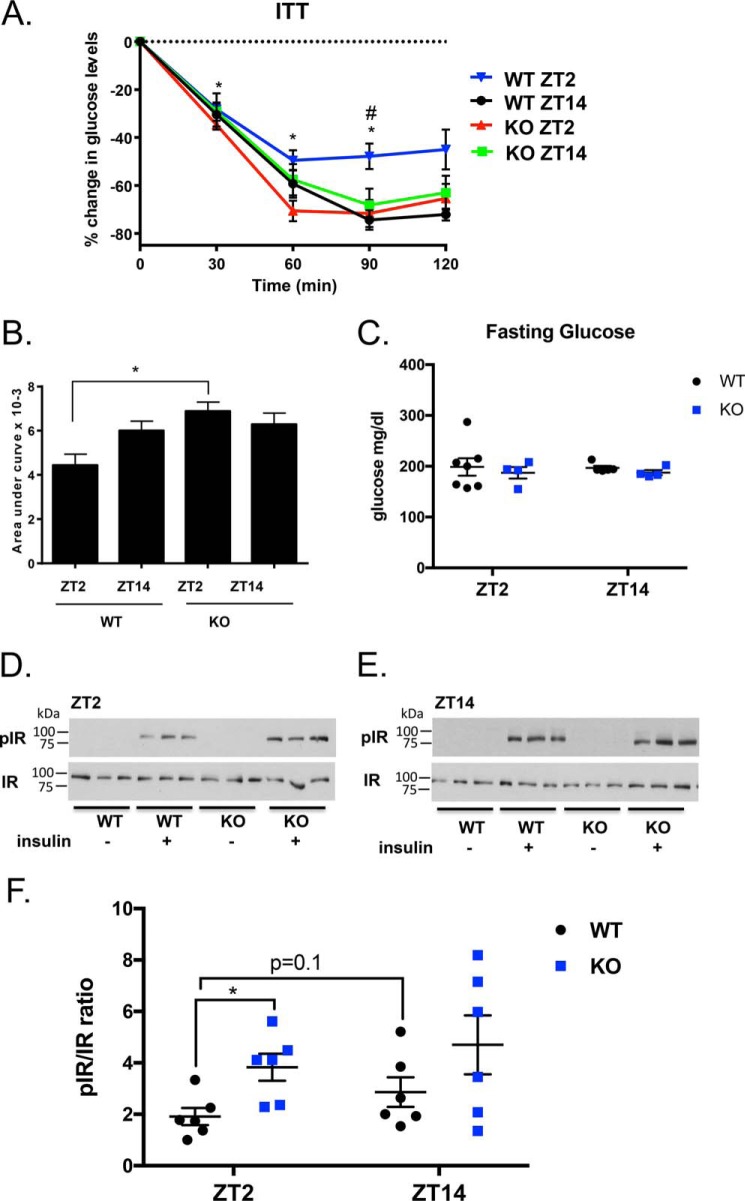
Figure 5.
STRA6 regulates diurnal insulin responses in WAT. A, ITT (0.75 units/kg) in WT and STRA6-null male mice performed at ZT2 and ZT14. Data are represented as mean ± S.E. * denotes p < 0.02 comparing WT between time points ZT2 and ZT14. # denotes p < 0.05 comparing WT versus KO at the same time point. B, area above the curve data calculated from baseline from the ITT. C, serum glucose levels in male mice after a 4-h fast at ZT2 and ZT14 in WT and STRA6-null mice. D and E, Western blot analysis for pIR and IR from epididymal WAT collected from male mice before and after 5 min injection of insulin (1 μg/g) in WT and STRA6-null mice performed at ZT2 or ZT14. F, quantification of Western blots from D and E with n = 6 mice per group. Each blot was contained as an internal standard to accurately compare blot exposure and allow for quantification.

