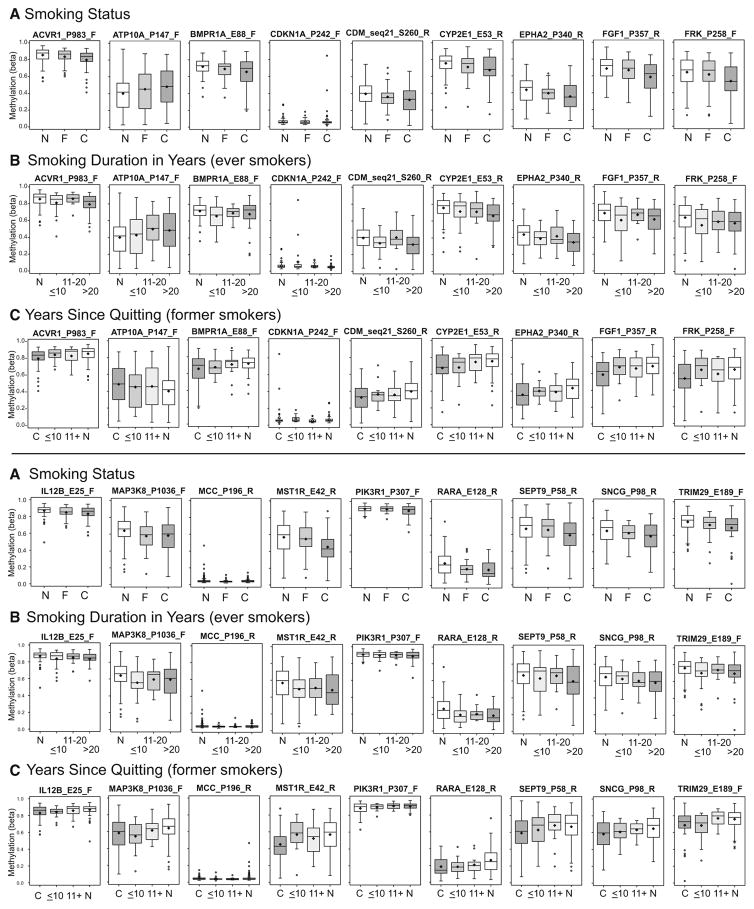
Fig. 2.
Boxplots illustrating methylation levels at top CpGs differing in methylation between current and never smokers with HR− breast tumors. a Methylation differences according to smoking status in current (C) (n = 37) or former (F) (n = 34) smokers compared with never smokers (N) (n = 92). b Methylation with increasing duration of smoking in years among ever smokers: N (n = 92), ≤10 (n = 25), 11–20 (n = 16), or >20 years (n = 29). c Methylation with years since quitting among former smokers: C (n = 37), ≤10 (n = 18), 11+ (n = 16), N (n = 92). Never or current smokers are included for reference in some plots as appropriate. Boxplot boundaries indicate the interquartile range, and mean and median are indicated by the black bar and diamond, respectively

