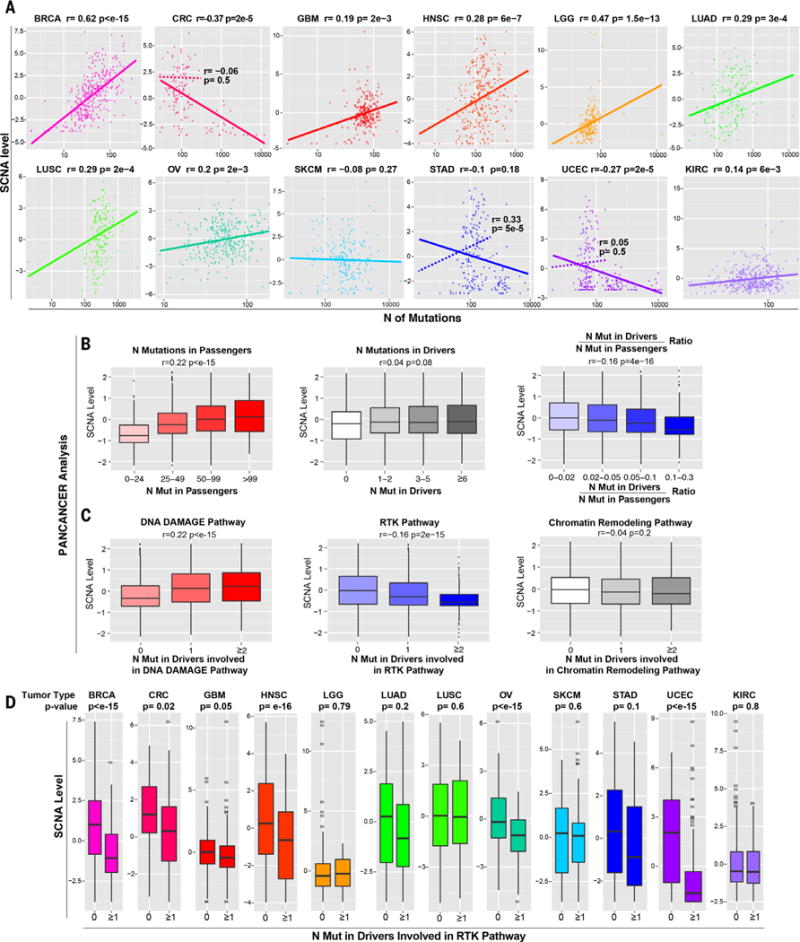
Fig. 1. Relationship between SCNA level and point mutations.

(A) For each tumor type, a plot is shown containing the calculated SCNA level (see Materials and methods) versus the total number of mutations in exons. The Spearman correlation coefficient and P value are shown. For CRC, STAD, and UCEC, two plots are shown, based either on all tumors (solid line) or after excluding hypermutated samples (dashed line; see also fig. S1A, table S1, and Materials and methods). (B and C) Pan-cancer analysis showing the relationship between the SCNA level and the number of mutations in passenger genes, functionally relevant mutations in OG and TSG drivers predicted by TUSON (11) or the ratio between the number of mutations in these drivers and passengers (B), and the number of drivers involved in the indicated pathways (C) (table S2B). Only tumor samples with a total number of exonic mutations lower than 400 were considered to exclude hypermutated samples. The Spearman correlation coefficient and P value are shown (see table S2 for the same analysis including hypermutated samples). (D) The relationship between the SCNA level and the presence of at least one functionally relevant mutation in TSGs or OGs involved in the RTK pathway [as in (C); see table S2, B and D] is shown as a box plot (P values refer to Wilcoxon test). The hypermutated samples were excluded (see Materials and methods).
