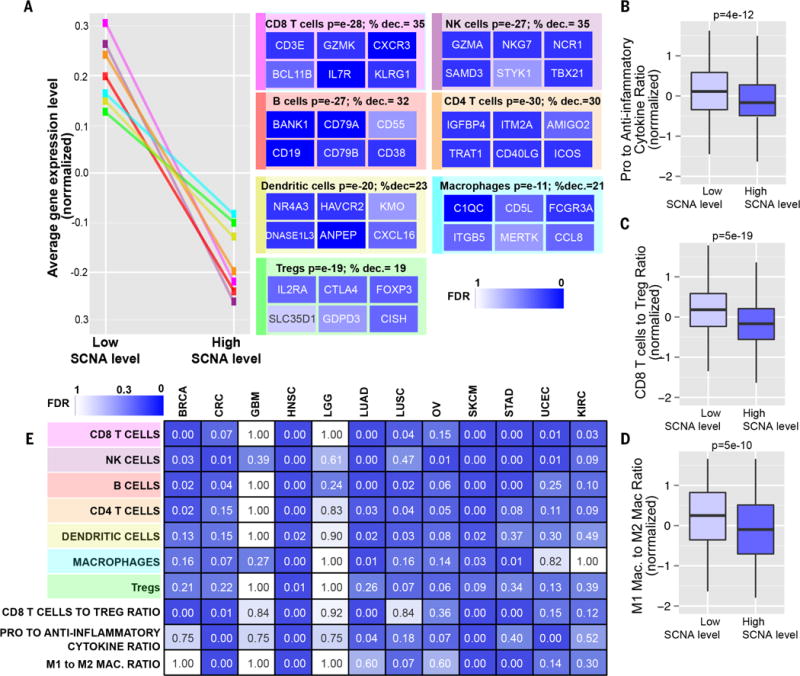
Fig. 3. Markers of specific immune cells in high versus low SCNA level tumors.

(A) Sets of genes specific for different types of immune cells (see table S4D) were analyzed for their expression in tumors with low or high SCNA levels in the pan-cancer analysis. Representative genes characterizing each immune cell type are shown with a heat map representing the corresponding FDR derived from the RNA-seq analysis (% dec., percent decrease). (B to D) Box plots of the gene expression ratios (normalized, presented as Z score) of (B) proinflammatory (IFN-γ, IL-1A, IL-1B, and IL-2) versus anti-inflammatory genes (TGFB1, IL-10, IL-4, and IL-11), (C) CD8+ Tcell–specific versus Treg-specific genes (table S4D), and (D) M1 macrophage–specific versus M2 macrophage–specific genes (see Materials and methods and table S4D). (E) RNA-seq analysis was performed comparing tumors with high versus low SCNA level for the indicated cancer types. Gene sets representing markers specific for the indicated immune cell types were used to perform a GSEA analysis as in (A). For the signatures “CD8+ T cell to Treg ratio,” “pro- to anti-inflammatory cytokines ratio,” and “M1 to M2 macrophage ratio,” a similar analysis to the one shown in (B) to (D) was performed. The FDR is shown using a heat map.
