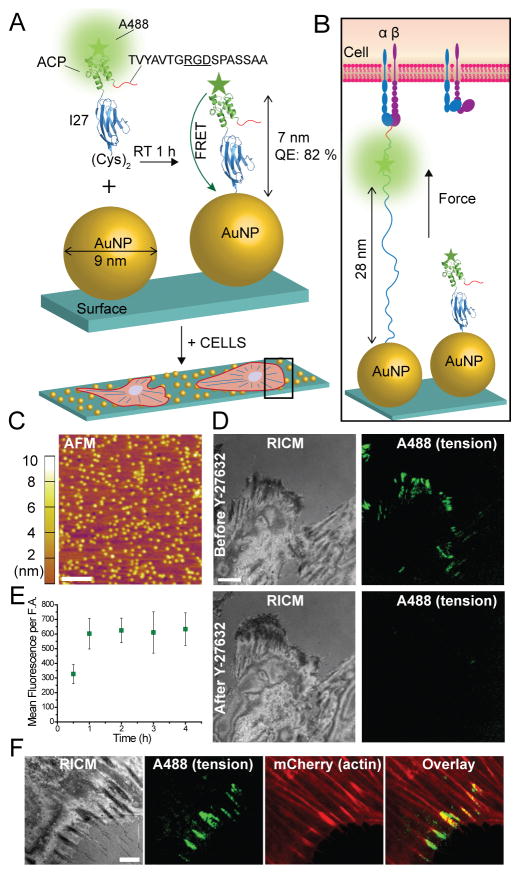
Figure 1.
I27-based MTFM probes reveal integrin forces within FAs. (A–B) Schematic illustration showing the RGD-ACP(A488)-I27 probe and the mechanism of sensing (PDB ID: TIT1 and 2492 for I27 and ACP, respectively). The probe is modified at the N terminus with FN binding motif TVYAVTGRGDSPASSAA. The C terminus included two cysteine residues for binding to the AuNP. (C) AFM image of 9 nm AuNPs immobilized on the glass coverslip. Scale bar, 200 nm. (D) Representative RICM and fluorescence images of cells incubated on the tension probe surface before and after treatment with a myosin inhibitor Y-27632 (40 μM) for 30 min. Scale bar, 10 μm. (E) Plot of the average fluorescence tension signal per FA as a function of time. The error bars represent the SEM from n = 5 cells at each time point.

