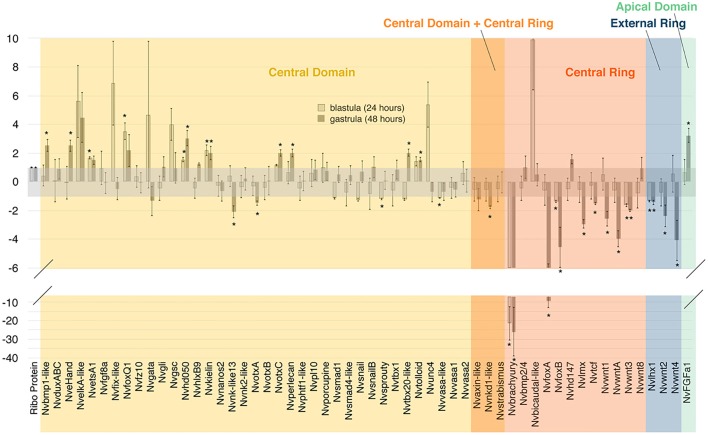
Fig. 4.
qPCR of genes of the blastoporal gene regulatory network. Bars indicate relative levels of expression of genes at 24 and 48 hpf. Samples were normalized to ribosomal protein P0. Reductions in expression are shown as the negative reciprocal of the expression level, in order to facilitate visualization. Asterisks indicate significant differences (*P<0.05).

