
Fig. 1.
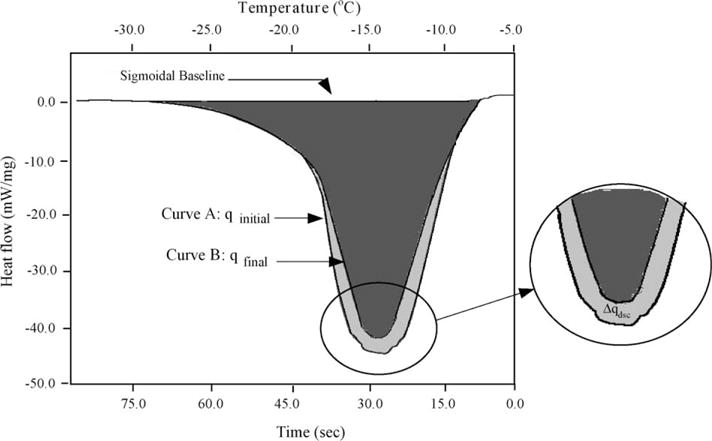
Superimposed heat flow thermograms obtained during the initial (osmotically active cells; Curve A) and final (osmotically inactive cells; Curve B) cooling trials of X. helleri sperm cells at 20 °C/min obtained in the presence of DMSO. The negative values on the y-axis for the heat flow implies an exothermic heat release in the DSC sample. The heat flow (mW/mg) is plotted along the y-axis and the sub-zero temperatures (°C) are plotted along the top x-axis and time (s) is plotted on the bottom x-axis.