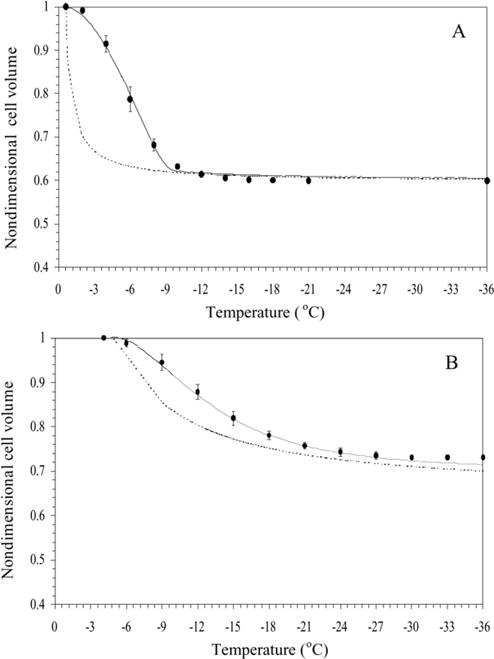
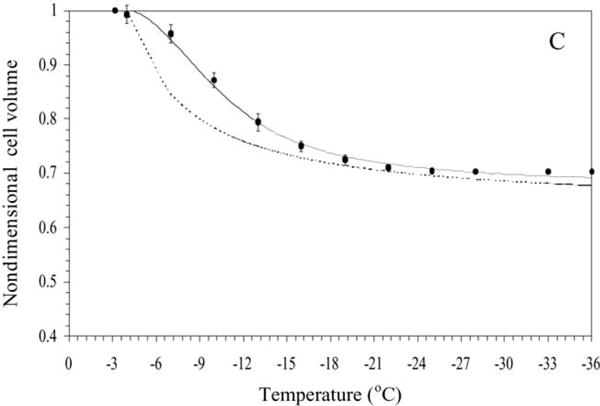
Fig. 3.


Volumetric response of X. helleri sperm cells as a function of sub-zero temperatures obtained using the DSC technique in the presence of extracellular ice (A), in the presence of extracellular ice and glycerol (B), and in the presence of extracellular ice and DMSO (C). The filled circles represent the experimentally obtained water transport (volumetric shrinkage) at a cooling rate of 20 °C/min. The dynamic cooling response at 20 °C/min is shown as a solid line and was obtained by using the “best fit” membrane permeability parameters (Lpg and ELp or Lpg[cpa] and ELp[cpa]) (Table 1) in the water transport equation (Eqs. (3) and (4)). The model-simulated equilibrium cooling response obtained is shown as a dotted line in all the figures. The non-dimensional cell volume is plotted along the y-axis and the sub-zero temperatures are shown along the x-axis. The error bars represent the standard deviation for the mean values of nine separate DSC experiments (n = 9).
