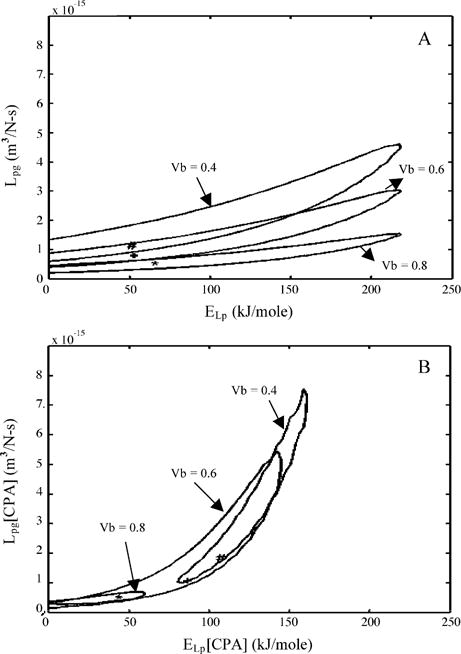
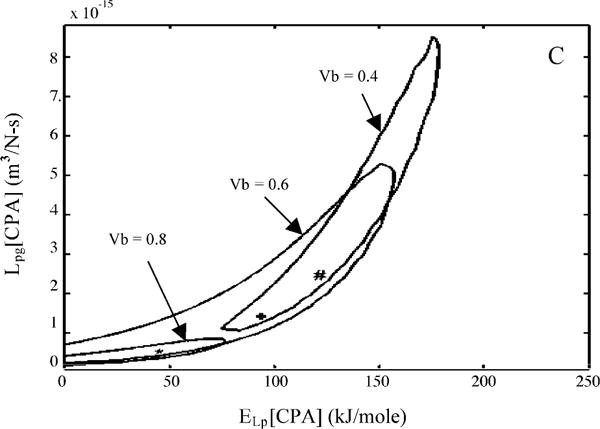
Fig. 6.


Contour plots of the goodness of fit parameter R2 (= 0.96) for water transport response in X. helleri sperm cells in three different media: HBSS with no CPAs (A), HBSS with 14% glycerol (B), and HBSS with 10% DMSO (C). Within each figure, the three contour correspond to the three assumed values of osmotically inactive cell volume, Vb (0.4Vo, 0.6Vo, and 0.8Vo). Note that the best-fit parameters (Tables 2 and 3) are represented within the contours by a “#” (Vb = 0.4Vo), “+” (Vb = 0.6Vo) and “*” (Vb = 0.8Vo). The membrane permeability at 0 °C, Lpg (or Lpg[cpa]) (m3/Ns) is plotted on the y-axis while the apparent activation energy of the membrane, ELp (or ELp[cpa]) (kJ/mol) is plotted on the x-axis.
