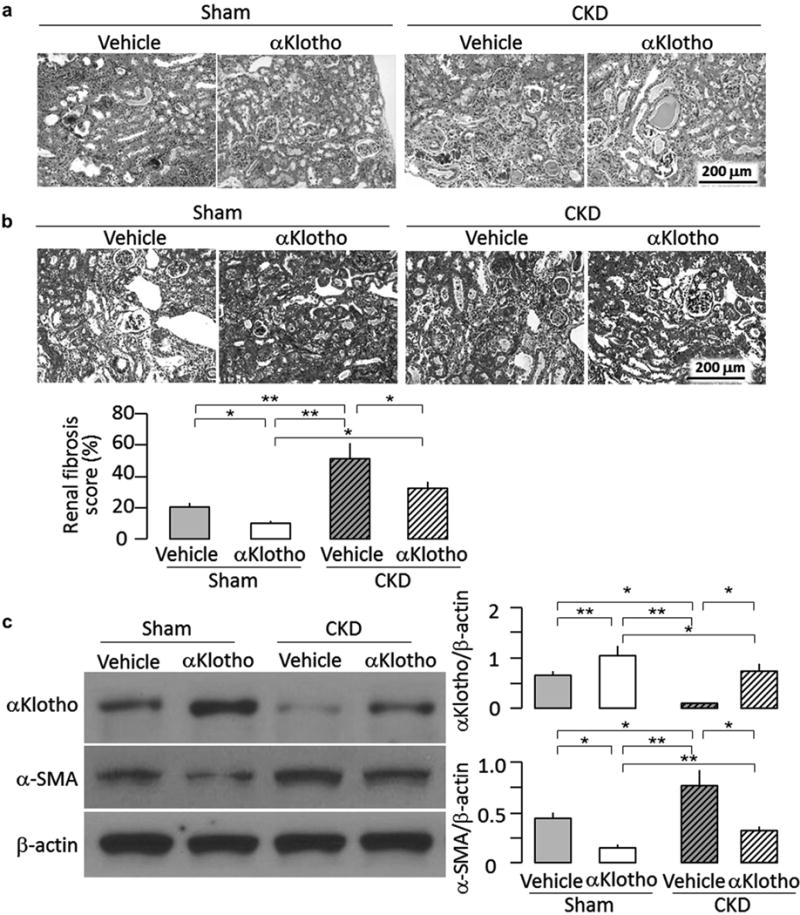
Figure 4. Effects of chronic administration of αKlotho after established chronic kidney disease (CKD) on kidney histology and renal αKlotho expression.

Animal experimental design was shown in Figure 3a. At 16 weeks, the kidneys were harvested for renal histology and immunoblot analysis, (a) Representative renal micrographs of hematoxylin-eosin stained kidney sections, (b) Renal fibrosis in mice at 16 weeks. Upper panel shows representative micrographs of trichrome-stained kidney sections. Bottom panel shows renal fibrosis scores from trichrome section calculated using ImageJ software, (c) αKlotho and fibrotic markers in the kidney. Left panel shows representative immunoblots for αKlotho, α-smooth muscle actin (α-SMA), and β-actin protein. Right panel shows a summary of normalized protein quantification from all examined immunoblots. Data are expressed as means ± SD of 4 mice from each group. Statistical significance was assessed by 1-way analysis of variance followed by Student-Newman-Keuls test and accepted when: *P < 0.05, **P < 0.01 between 2 groups.
