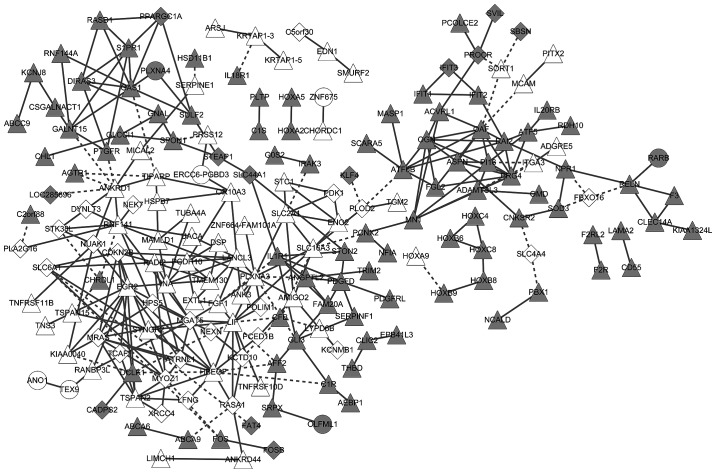
Figure 4.
Gene co-expression network. Grey nodes, downregulated genes; white nodes, upregulated genes; round nodes, MGUS-specific genes; diamond nodes, MM-specific genes; triangular nodes, common genes between MGUS and MM. Solid lines indicate positive correlations, dotted lines indicate negative correlations. MGUS, monoclonal gammopathy of undetermined significance; MM, multiple myeloma.

