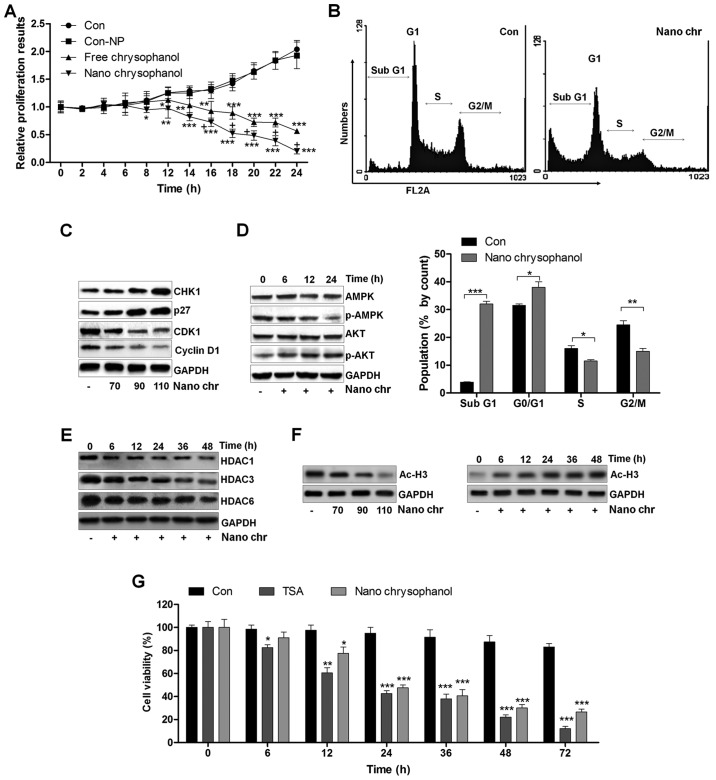
Figure 3.
The effects of chrysophanol nanoparticles on prostate cancer cell proliferation and cell arrest. (A) LNCap cells were exposed to free chrysophanol, chrysophanol nanoparticle or only the nanoparticles in the absence of drug conjugation at 90 μM for 0, 2, 4, 6, 8, 12, 14, 16, 18, 20, 22 or 24 h. Then, the cell viability was evaluated using MTT analysis. *P<0.05, **P<0.01 and ***P<0.001 versus the control group in the absence of any treatments. (B) Upper, chrysophanol nanoparticle (90 μM) was added to LNCap cells for 24 h, and then cell cycle analysis was performed. Lower, the quantification of cells in different phases of cell cycle is exhibited. *P<0.05, **P<0.01 and ***P<0.001. LNCap cells were treated with 90 μM chrysophanol nanoparticle for 24 h. (C) Then, western blot analysis of CHK1, p27, CDK1 and cyclin D1 was carried out. (D) AMPK and AKT phosphorylation was calculated using western blot analysis. (E) LNCap cells were treated with 90 μM chrysophanol nanoparticle for different times, ranging from 0 to 48 h, followed by HDAC1, HDAC3 and HDAC6 measurement by western blot assays. (F) LNCap cells were treated as indicated. Then, western blot analysis was used to calculate the expression levels of Ac-H3. (G) LNCap cells were administered with HDACs inhibitor, TSA (5 μM), and chrysophanol nanoparticle (90 μM) for the described time, followed by MTT analysis. *P<0.05, **P<0.01 and ***P<0.001 versus the control group in the absence of any treatments. Data are shown as mean ± SEM.

