Figure 1.
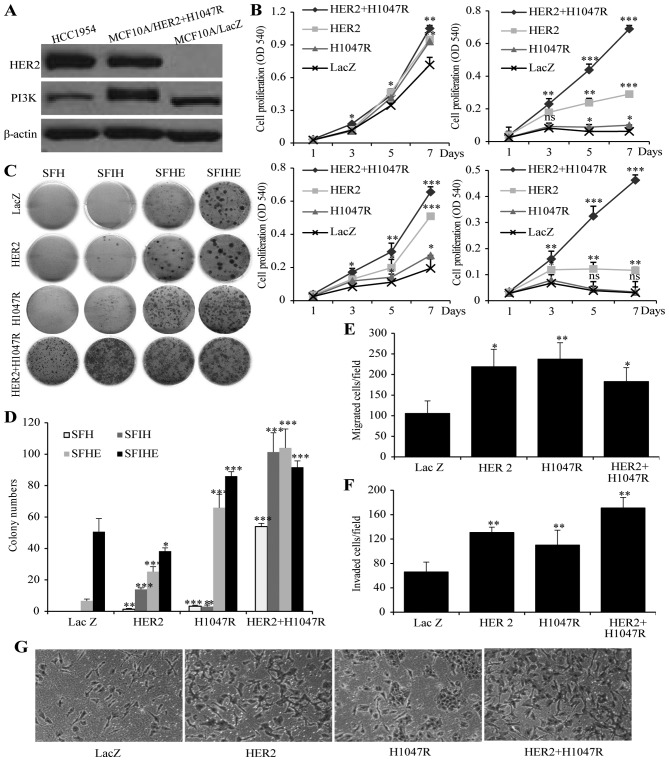
The effect of HER2 or/and PIK3CA-H1047R on cell proliferation, invasiveness and colony formation. (A) expression of PIK3CA and HER2 gene in MCF10A/HER2/PIK3CA-H1047 cells and HCC1954 cells. MCF10A/LacZ was used as negative control. (B) Cell proliferations of MCF10A/HER2/PIK3CA-H1047R, MCF10A/HER2, MCF10A/PIK3CA-H1047R and MCF10A/LacZ cells when cultured in SFIHE (top left), SFIH (top right), SFHE (bottom left), and SFH (bottom right) media. (c) Different capability in colony formation of MCF10A/HER2/PIK3CA-H1047R, MCF10A/HER2, MCF10A/PIK3CA-H1047R and MCF10A/LacZ cells when cultured in SFH, SFHE, SFIH and SFIHE media. (D) Summary of the colony formation assay under different cell culture conditions. Data are mean ± SD. (e) MCF10A/HER2/PIK3CA-H1047R, MCF10A/HER2 and MCF10A/PIK3CA-H1047R exhibited higher migration ability than MCF10A/Lac Z (negative control). (F) The effects of MCF10A/HER2/PIK3CA-H1047R, MCF10A/HER2, MCF10A/PIK3CA-H1047R and MCF10A/LacZ on cell invasion. Columns mean of three independent experiments. Bars mean SD. The MCF10A/LacZ was used as a control (100%). The invasion ability (%) was measured by the invading cell number of each cell line comparing to the invading cell number of MCF10A/LacZ cell line. Student's t-test was used for statistical analysis. ***P<0.001, **0.01>P>0.001; *0.05>P>0.01; ns, not significant. (g) representative images showing invading cells in Matrigel invasion chambers for four cell models. Original magnification, ×100.

