Figure 3.
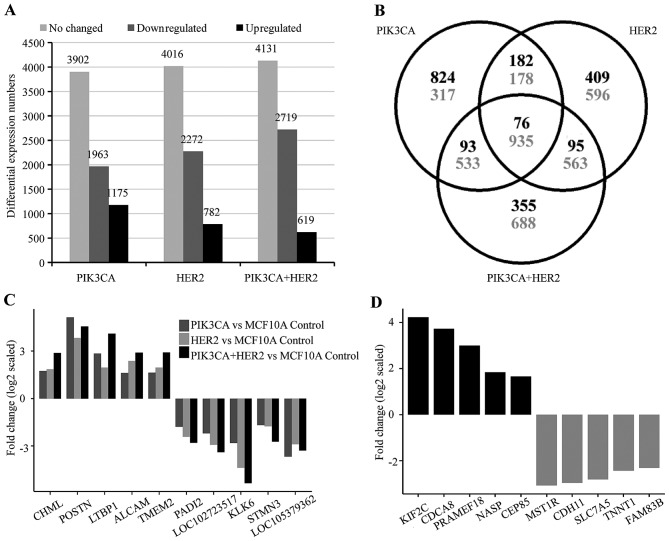
Downstream target genes regulated by HER2, mutant PIK3CA and both of HER2 and mutant PIK3CA. (A) The resulted number of probe sets that upregulated, downregulated, or no change in MCF10A/HER2, MCF10A/PIK3CA-H1047R and MCF10A/HER2/PIK3CA-H1047R models after compared to control cell model MCF10A/LacZ. (B) Venn diagram shows common and differential expressed probe sets among three cell models. Black: upregulated; gray: downregulated. (C) The top 5 upregulated and top 5 downregulated common downstream gene targets in three comparisons of MCF10A/HER2 vs. MCF10A/LacZ; MCF10A/PIK3CA-H1047R vs. MCF10A/LacZ, and MCF10A/HER2/PIK3CA-H1047R vs. MCF10A/LacZ control. (D) Specific deregulated genes were identified in MCF10A/HER2/PIK3CA-H1047R cells, but not in either MCF10A/HER2 or MCF10A/PIK3CA-H1047R cells, after compared to MCF10A/LacZ control cells. Top 10 up-/down-regulated genes are shown here. Probe sets with log2 expression values <4 for any two cell lines compared were excluded.

