Figure 4.
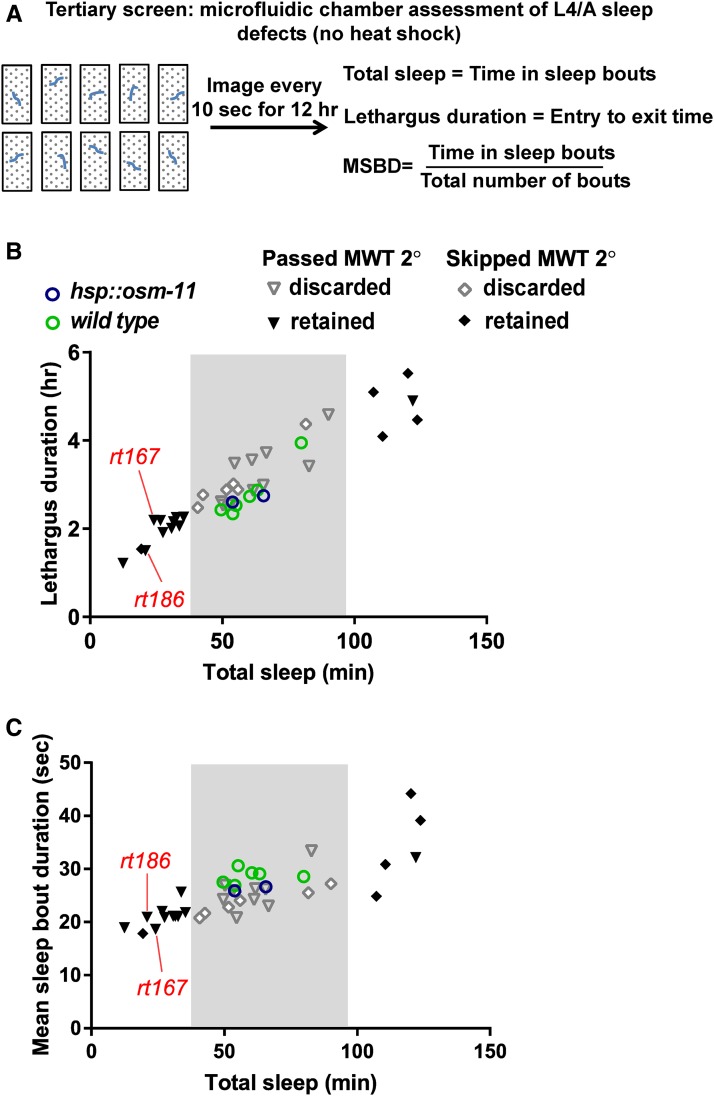
Tertiary screen: microfluidic chamber sleep assay. (A) Diagram of the microfluidic chamber assay. Early- to mid-L4 animals were loaded into microfluidic chambers and imaged every 10 sec for 12 hr (as in Figure 3B). These animals were not heat shocked. Sleep during lethargus was measured for each animal tested using the metrics defined previously and shown here. Total sleep is the sum of time in sleep bouts during L4/A lethargus. Lethargus duration is defined as the time between the appearance and cessation of frequent sleep bouts. We did not determine if vulval eversion or ecdysis timing was changed for Ans suppressor lines. Mean sleep bout duration (MSDB) is the total sleep divided by the total number of sleep bouts during lethargus. (B) Plot of lethargus duration (y-axis) vs. total time in L4/A sleep (x-axis) for all lines tested in the tertiary screen. (C) Plot of MSBD (y-axis) vs. total time in L4/A sleep (x-axis) for the same lines in B. Each data point represents the mean of at least 10 animals from each line/genotype. Control strains are shown as circles. There is no significant difference between wild-type (green circles) and hsp::osm-11 (blue circles) animals. Lines that passed the preceding MWT secondary screen are shown as triangles; lines tested here that bypassed the MWT secondary screen are shown as diamonds. Sixteen lines altered L4/A lethargus sleep and were retained (outside pale gray boxes, black triangles, or black diamonds). goa-1(rt167) and gpb-2(rt186) are indicated.

