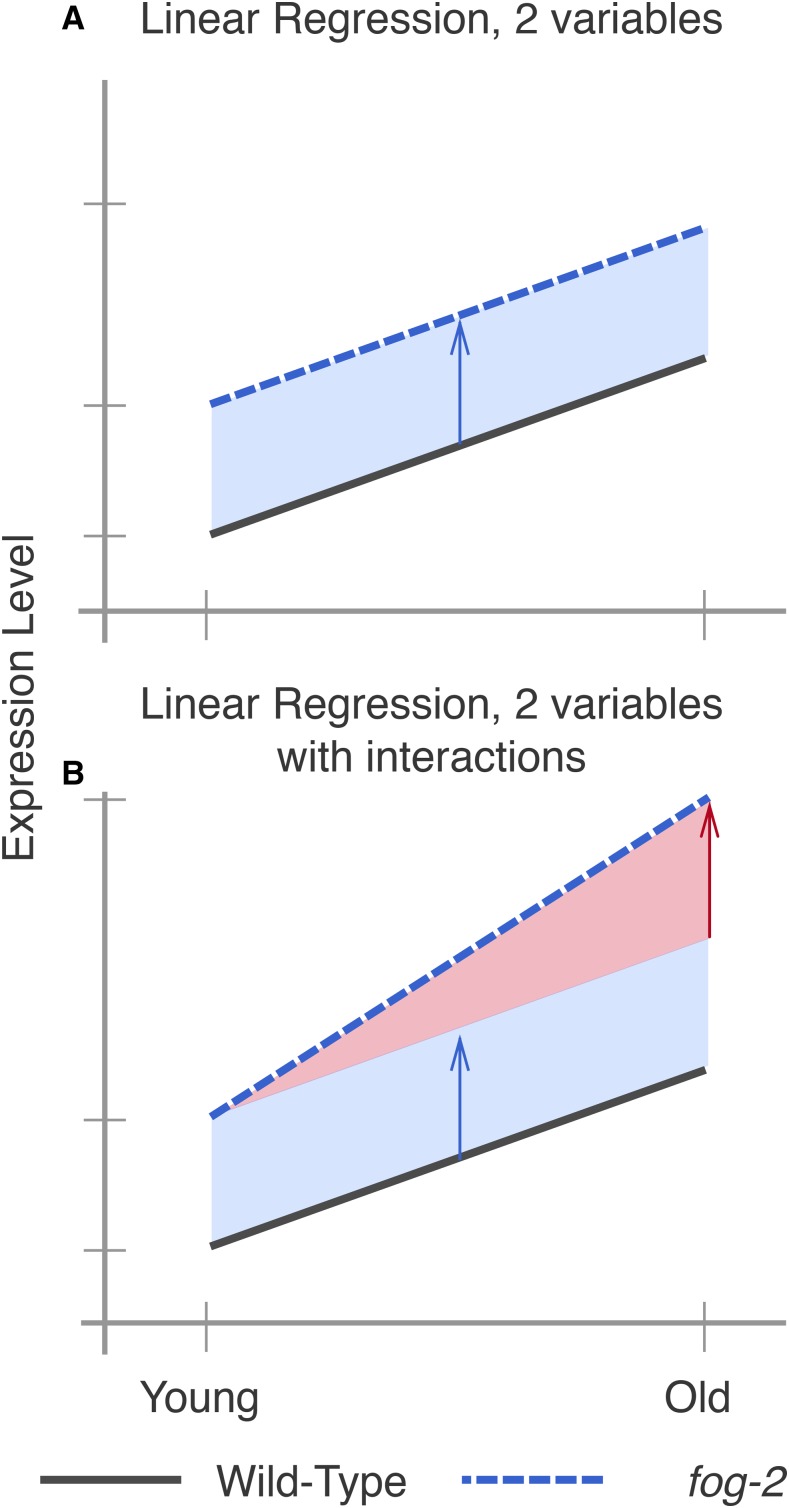
Figure 3.
Explanation of linear regressions with and without interactions. (A) A linear regression with two variables, age and genotype. The expression level of a hypothetical gene increases by the same amount as worms age, regardless of genotype. However, fog-2(lf) has higher expression of this gene than the wild type at all stages (blue arrow). (B) A linear regression with two variables and an interaction term. In this example, the expression level of this hypothetical gene is different between wild-type worms and fog-2(lf) (blue arrow). Although the expression level of this gene increases with age, the slope is different between wild type and fog-2(lf). The difference in the slope can be accounted for through an interaction coefficient (red arrow).

