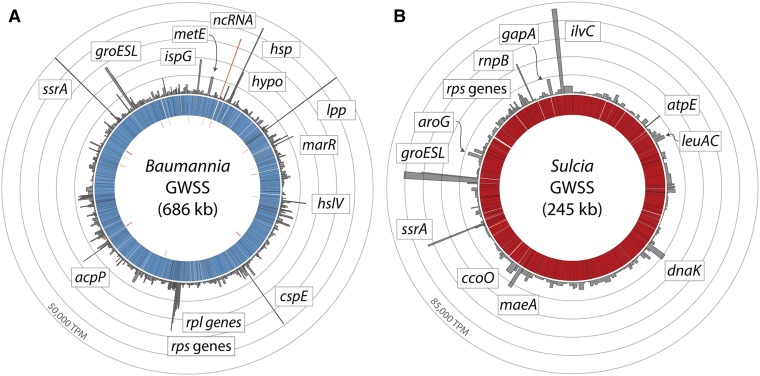
Figure 2.
Genome-wide gene expression profiles for (A) Baumannia and (B) Sulcia symbionts from the sharpshooter insect host, Homalodisca vitripennis (GWSS). Bar graphs show per gene TPM estimates for replicate 1 (see Table 1) of the yellow bacteriome. Inner rings and striations show the bacterial genomes and individual genes. Tick marks on the innermost ring show the locations of predicted noncoding RNAs. A selected set of the most highly expressed genes is labeled with gene shorthand names; not all genes discussed are labeled owing to space constraints. See Supplemental Material for complete TPM values (Table S1) and stranded expression counts (Figure S1).

