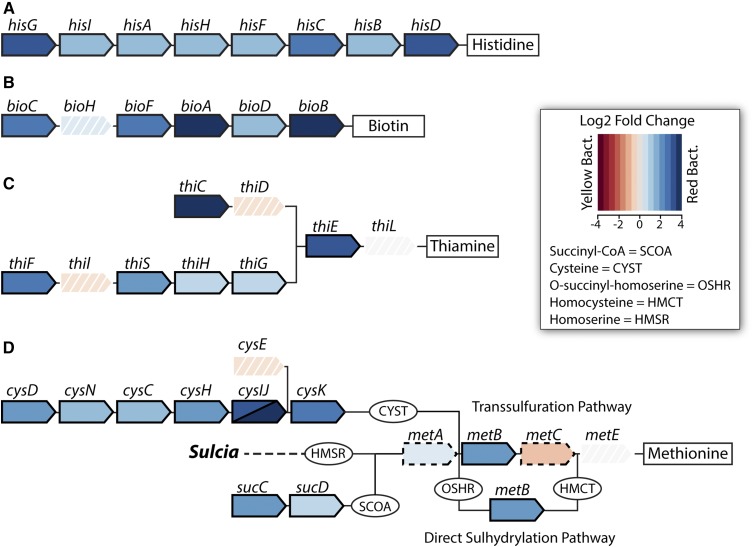
Figure 4.
Differential gene expression values of Baumannia genes between bacteriome tissue types related to nutrition synthesis pathways: (A) histidine, (B) biotin, (C) thiamine, and (D) methionine (see Figure 1). Individual genes are represented by arrow-shaped polygons with gene names above. Intermediate metabolites are shown for some pathways and abbreviated (see legend). Genes with solid borders are significantly differentially expressed at a log2 fold change threshold (FCT) of 1.0 (>2× fold change). Genes with dashed borders show moderate significant differential expression at FCT = 0.5. Genes with white borders and hash marks are not significantly differentially expressed. Genes shown in shades of blue are more highly expressed in the red bacteriome, and genes shown in red are more highly expressed in the yellow bacteriome (see legend).

