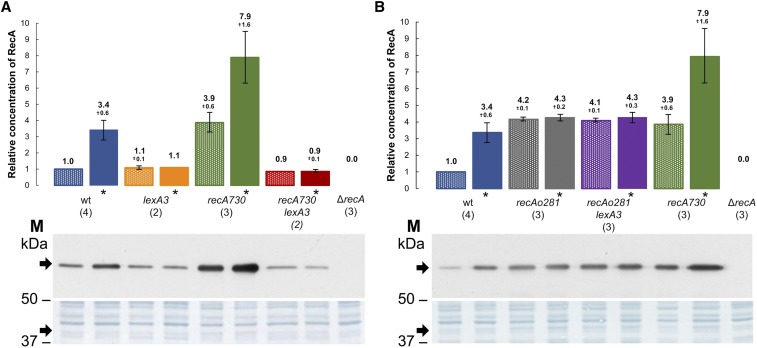
Figure 2.
Immunoblotting analysis of relative RecA protein concentrations in E. coli (A and B). Protein samples obtained from the cells that were irradiated with 400 Gy of γ-rays and subsequently incubated for 35 min at 37° are marked with *. PVDF membranes stained with Amido Black were used as a loading control (lower panels). SDS-PAGE gels and PVDF membranes are from one experiment, while graph depicts mean and SD (error bars) from multiple replicates (numbered in parentheses) from two independent experiments. PVDF, polyvinylidene fluoride; SDS-PAGE, sodium dodecyl sulfate polyacrylamide gel electrophoresis; wt, wild-type.

