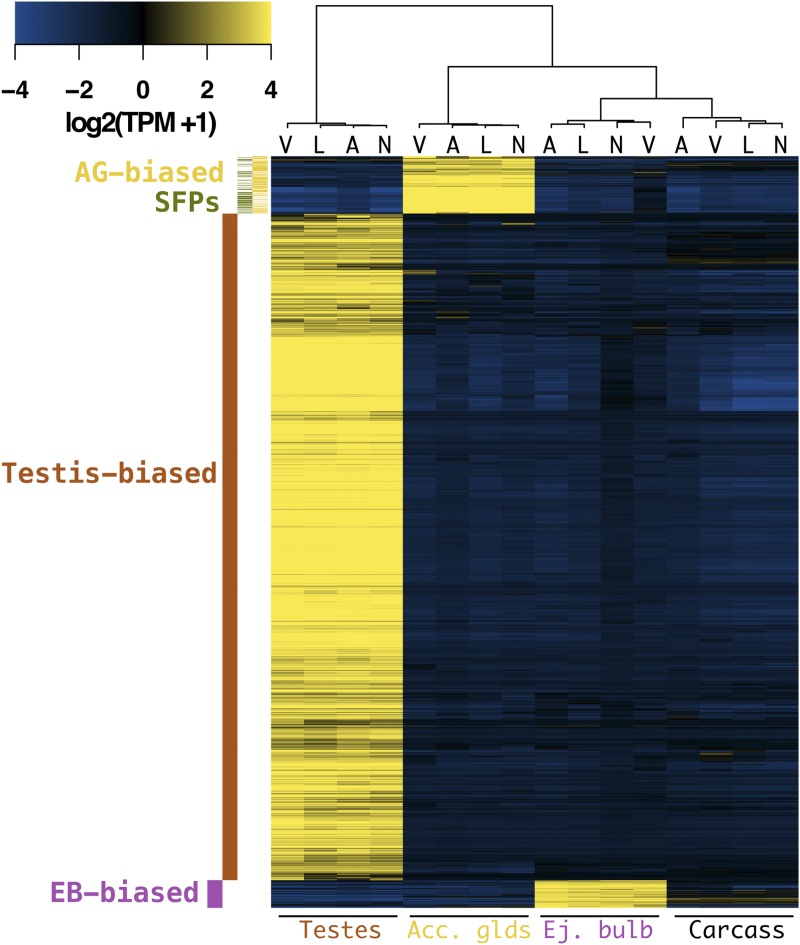
Figure 2.
Male reproductive genes of the virilis group: Heatmap of tissue-biased genes that are shared among virilis group members (heat-scale is median-centered for each gene). The color code on the left indicates the tissue-bias classification (SFPs are the subset of AG-biased genes with a predicted signal peptide). The cladogram on top depicts species clustering (A, D. americana; L, D. lummei; N, D. novaexicana; V, D. virilis). Species strongly cluster by tissue type, but only clustering of testes-biased genes reflects the true phylogeny.

