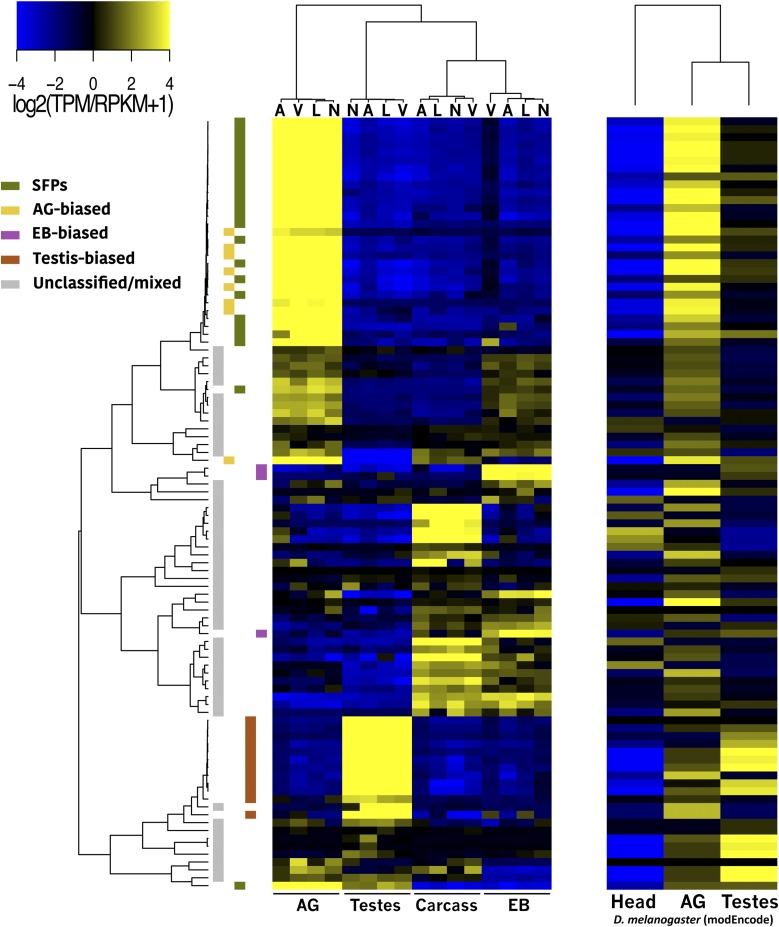
Figure 5.
D. melanogaster SFPs and their orthologs in D. virilis: expression heatmap of D. melanogaster SFPs (right) and their orthologs in D. virilis (left). The heat-scale shows expression values in median-centered TPM (virilis data) or RPKM (D. melanogaster data). The left cladogram shows complete-linkage clustering relationships of virilis group orthologs, and the color key on the left indicates shared tissue-bias status among virilis group species. The cladogram on top of the virilis group heatmap depicts species clustering (abbreviations as in Figure 2), and the cladogram on top of the D. melanogaster data depicts sample clustering.

