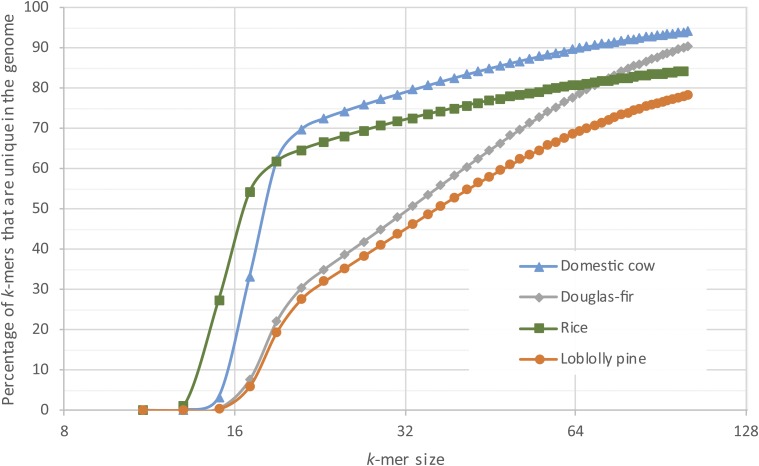
Figure 1.
Comparison of the k-mer uniqueness ratio in the assemblies of Pseudotsuga menziesii (Douglas-fir), Pinus taeda (loblolly pine), O. sativa (rice), and B. taurus (domestic cow). Shown is the percentage of sequences of length k (k-mers) in each genome that occur exactly once (i.e., that are unique) as a function of the value of k. Curves that are lower in the figure are relatively more repetitive and thus more difficult to assemble.

