Figure 1.
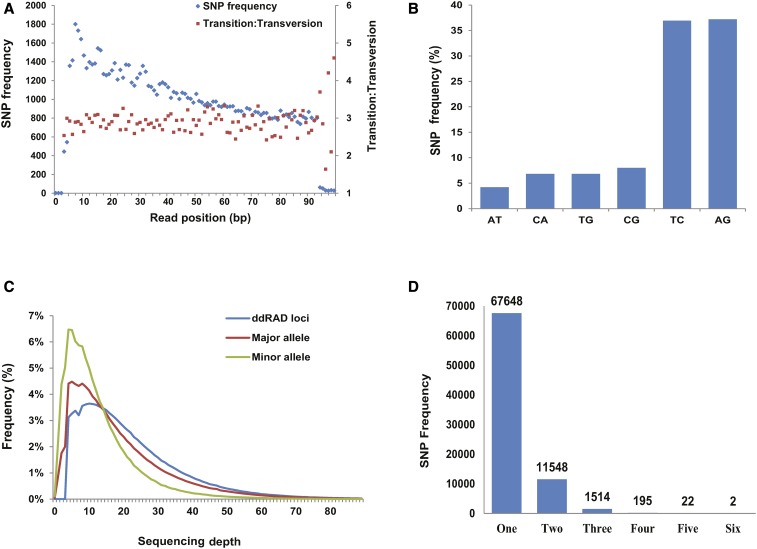
Evaluation of putative SNP quality. (A) Distribution of SNP frequency on ddRAD tag positions. Distribution of the identified Ts/Tv is also illustrated. (B) Distribution of six types of substitutions. (C) Distribution of SNP frequency in major allele, minor allele, and ddRAD loci against their sequencing depth. (D) Distribution of SNP frequency of the number of SNPs in ddRAD loci tags.

