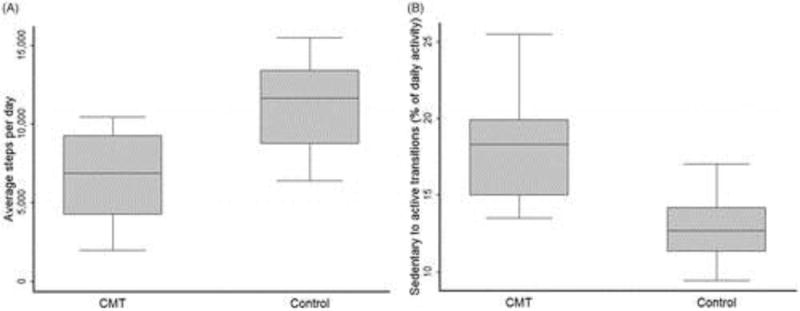
Figure 1.

(A) Box plot of mean (± standard deviation) average daily step rate over seven days for 20 people with CMT and 20 matched controls. The difference in means was significant, p < 0.0001. (B) Box plot of mean (± standard deviation) sedentary to active transitions for 14 people with CMT and 18 matched controls. The difference in means was significant, p < 0.001.
