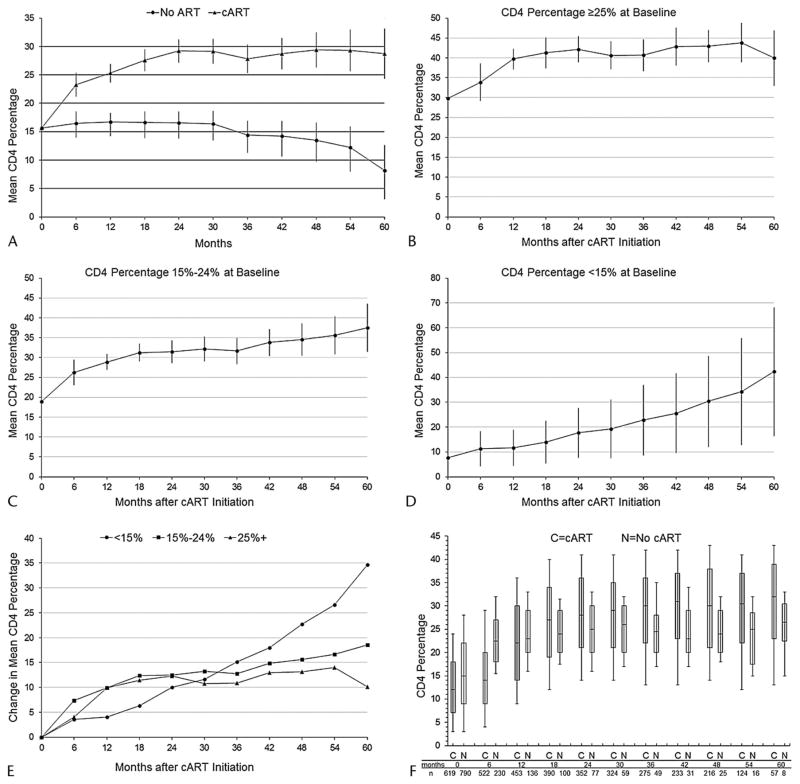
FIGURE 2.
Estimated effect of cART on CD4 percentage from marginal structural model,a overall (Panel A) and by category of CD4 percentage at baseline (Panels B–E), and observed unadjusted CD4 percentage evolutions among children receiving cART and children not receiving cART (Panel F),b 790 children initiating HIV care between December 2004 and May 2010 in Kinshasa, DRC. aEstimates are from repeated measures linear models, fit with generalized estimating equations, that include time modeled as a restricted cubic spline with 4 knots. To plot CD4 percentages among children not receiving cART, time was coded categorically (6-month periods). As there were no discernible upward or downward trends in CD4 percentage over time among children not receiving cART when spline terms were included as predictors in the stratum-specific models, it is assumed that the cumulative cART exposure parameters represent change from baseline. Error bars represent 95% CIs. bThe time scale for children not receiving cART is time since the start of follow-up, whereas the time scale for children receiving cART is time since cART initiation. Each box plot depicts the median and IQR, with the error bars marking the 10th and 90th percentiles. The most recent CD4 percentage was carried forward to each 6-month cut point.

