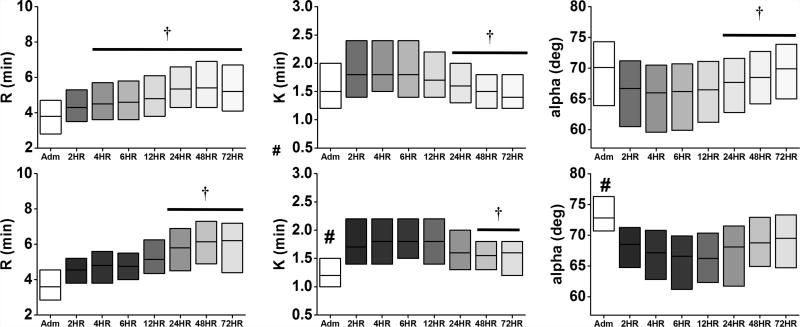
Figure 1.
Time course of TEG parameters (R, K, α-angle) relative to clot formation in non-VTE (top) and VTE (bottom) patients. The change in shade refers to each time point, ranging from admission to 72 hours. #p<0.05 vs No VTE at admission; †p<0.05 vs 2HR within group. Data are presented as median (IQR).

