Fig. 3.

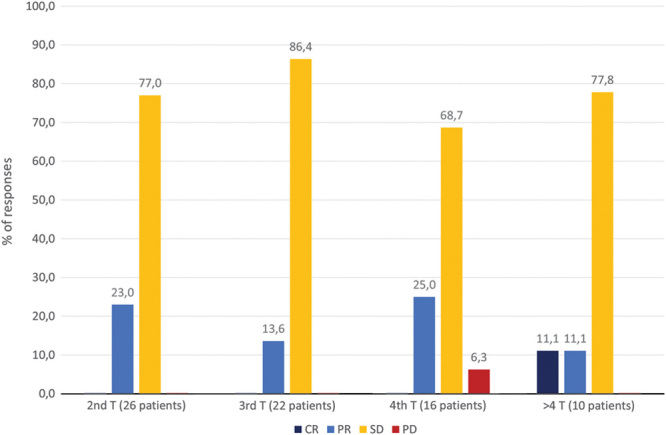
Percentages of responses in the treatments (T) following the first. CR, complete response; PD, progression disease; PR, partial response; SD, stable disease.

Percentages of responses in the treatments (T) following the first. CR, complete response; PD, progression disease; PR, partial response; SD, stable disease.