
Figure 5.
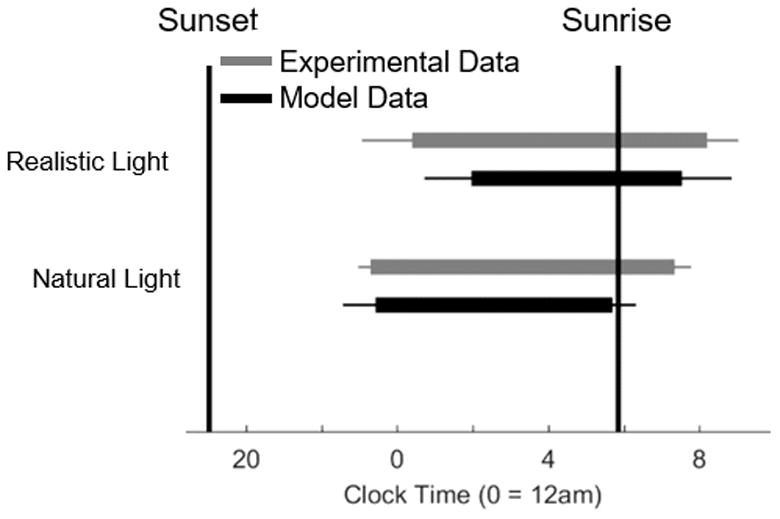
Raster diagram comparing the times of sleep averaged across the entire week between the natural and realistic conditions for both the experimental data and the model. The gray bars represent the data reported in the Wright et al. (2013) study. The black bars represent the data generated by the model. The error bars represent the standard deviation in sleep times for each condition.