
Figure 7.
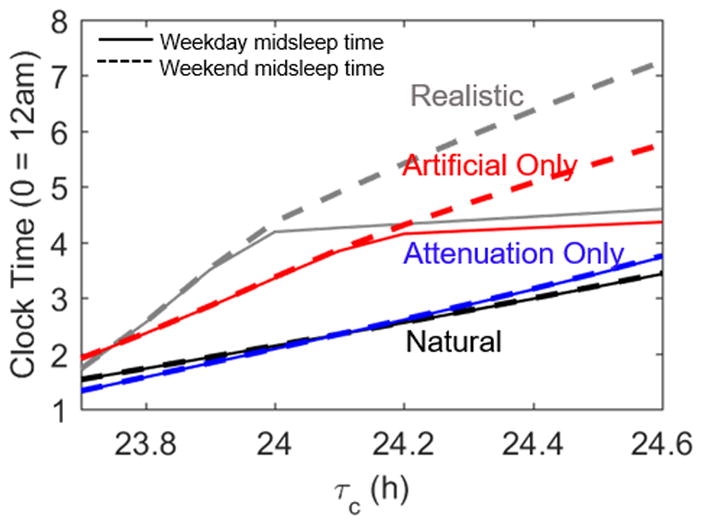
Midsleep time profiles across the natural range of τc values under different light profiles. In each condition, the solid line represents weekday midsleep times while the dashed line indicates weekend midsleep times. The black and gray lines are replicated from Figure 4 and represent the model’s behavior under natural and realistic light conditions. The blue lines result from altering the light profile only through attenuation of daytime light. The red lines come from only allowing the use of artificial light, without attenuating daylight light.