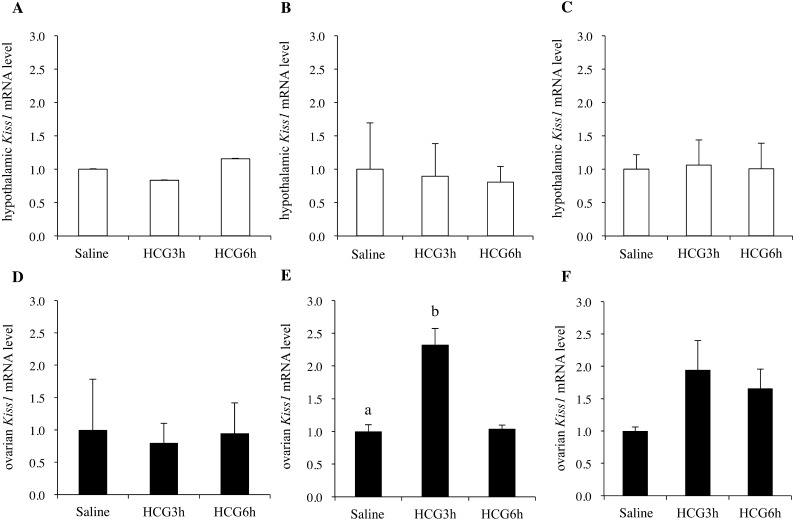
Fig. 5.
Hypothalamic (A, B, C) and ovarian (D, E, F) Kiss1 mRNA levels 3 h after saline injection, or 3 h or 6 h after HCG administration in rats on days (D) 10 (A, D), D20 (B, E), and D30 (C, F) (n = 7 per group). The mRNA levels in the hypothalamus are expressed as values relative to GAPDH, and those in the ovary are expressed as values relative to β-actin. The mRNA levels of the saline-injected groups were set as 1.0. Data are presented as the mean ± SD. a, b: different letters indicate different significant differences (P < 0.05).

