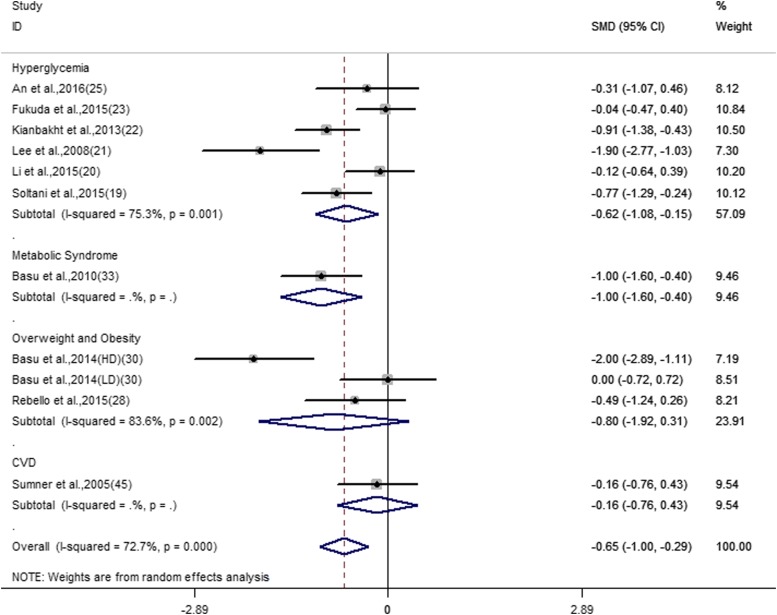
FIGURE 2.
Forest plot of the meta-analysis for the effect of anthocyanins on glycated hemoglobin. Data are pooled SMDs with 95% CIs and are calculated by a random-effects model. Subgroup analysis was performed according to different cardiometabolic risk status. The 2014 trial by Basu et al. (33) has 4 study arms: HD, LD, and 2 placebo controls. CVD, cardiovascular disease; HD, high dose; ID, identifier; LD, low dose; SMD, standardized mean difference.

