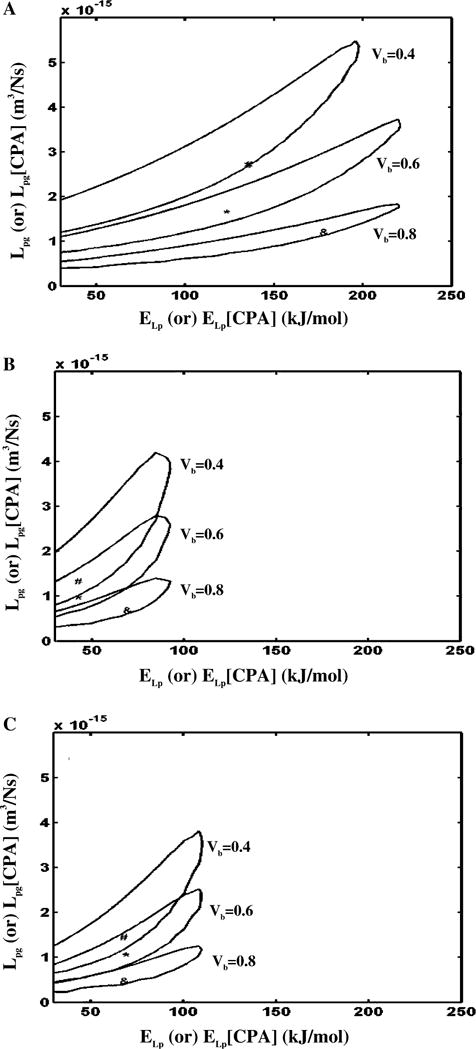
Fig. 4.

Contour plots of the goodness of fit parameter R2 (=0.98) for water transport response in X. maculatus sperm cells in three different media: HBSS with no CPAs (A), HBSS with 14% glycerol (B) and HBSS with 10% DMSO (C). Within each figure, the three contour correspond to the three assumed values of osmotically inactive cell volume, Vb (0.4 V0, 0.6 V0, and 0.8 V0). Note that the best fit parameters (Table 2) are represented within the contours by a “#” (Vb = 0.4 V0), “*” (Vb = 0.6 V0), and “&” (Vb = 0.8 V0). The membrane permeability at 0 °C, Lpg (or Lpg [cpa]) (m3/Ns) is plotted on the y-axis while the apparent activation energy of the membrane, ELp (or ELp [cpa]) (kJ/mol) is plotted on the x-axis.
