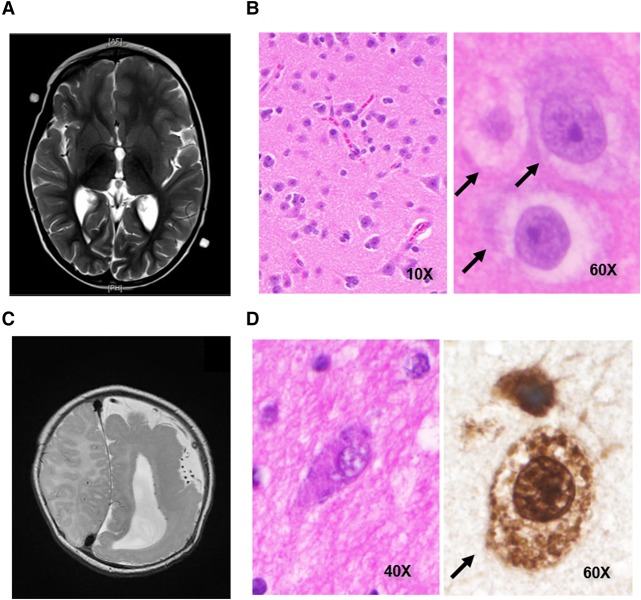
Figure 1.
Clinical and neuropathologic findings in HME1 and HME2. (A) T2-weighted magnetic resonance image (MRI) of HME1 showing left-sided hemimegalencephaly (HME). (B) Hematoxylin and eosin (H&E) staining of cortical brain tissue slices showing balloon cells (black arrows) in HME1 (left, 10× and right, 60×). (C) T2-weighted MRI of HME2 showing left-sided HME with pachygyria in the left parietooccipital region. (D) H&E (40×) or NeuN (60×) staining of cortical brain tissue slices from HME2 showing balloon cells (black arrow).

