Figure 1.
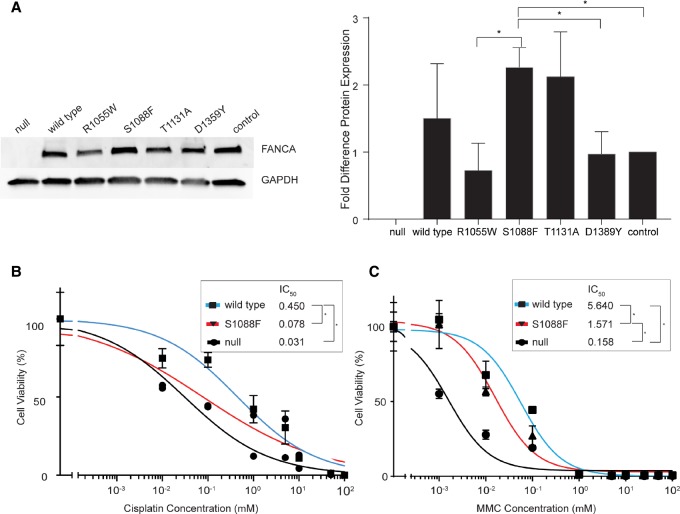
(A) Western blot of FANCA expression levels in isogenic cell lines. The graph indicates fold difference in the level of FANCA protein normalized to the FANCA endogenous control (* specifies P < 0.0439). (B) Drug sensitivity to cisplatin representing IC50 of null, wild-type, and S1088F cell lines (* specifies significant difference P < 0.004). (C) Drug sensitivity to mitomycin C (MMC) illustrating the IC50 (* indicates significant difference P < 0.006).

