Figure 3.

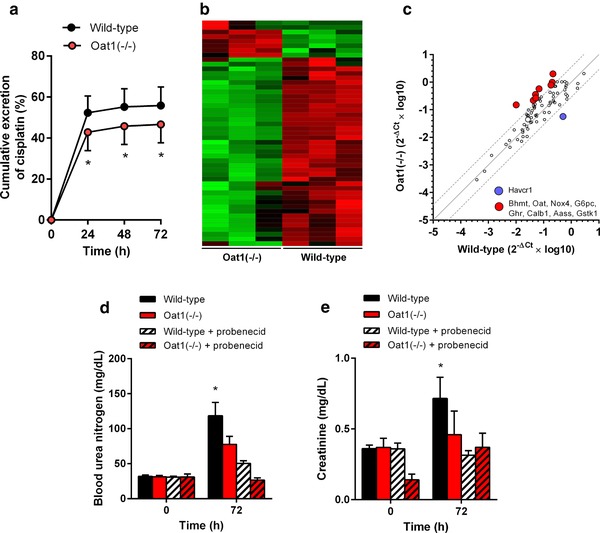
Cisplatin‐induced renal phenotypes in Oat1(–/–) mice. (a) Cumulative urinary excretion in wildtype and Oat1(–/–) mice within 72 h after cisplatin (30 mg/kg). (b,c) Comparative transcriptional profiling of 84 toxicity genes in kidney samples of wildtype and Oat1(–/–) mice after (30 mg/kg). Hierarchical clustering (b) was performed using Gapdh‐normalized data, and the color scale represents –1.5 SD (green) to 1.5 SD (red). In the correlation plot (c), each symbol represents a single gene, the solid line is the line of identity, and the dotted lines are the 95% confidence intervals. Levels of blood urea nitrogen (d) or serum creatinine (e) in wildtype or Oat1(–/–) mice are shown before and after cisplatin (30 mg/kg) with or without 3 probenecid administrations of 150 mg/kg (30 min before, 10 min after cisplatin, and 5 h after cisplatin). All data are represented by mean values (bars) and SD (error bars), using n = 3–6 per group. The star (*) represents P < 0.05 vs. the corresponding wildtype group.
